

Log-Based Root Cause Analysis, Fueled by Unsupervised AI
When critical business services go down, metrics can alert you to the issue, but identifying the root cause requires a time-consuming search through log files.
Skylar Automated Root Cause Analysis (RCA) does the heavy lifting for you, automatically ingesting and running machine learning (ML) log analysis across millions or billions of messages from log files across your applications. All done in real time, providing you with a human-centric Generative AI summary and remediation recommendations.
See our Automated RCA in action
Request a demo to see how Skylar Automated Root Cause Analysis (RCA) technology can analyze your logs and help troubleshoot incidents faster.
Diagnose Issues 10x Faster with Automated Root Cause Analysis (RCA)
When an application breaks, it’s a race against time to get it back online. Customers are frustrated, and critical resources are pulled from other work.
- Eliminate much of the manual work required to diagnose root cause from logs using AI log analysis.
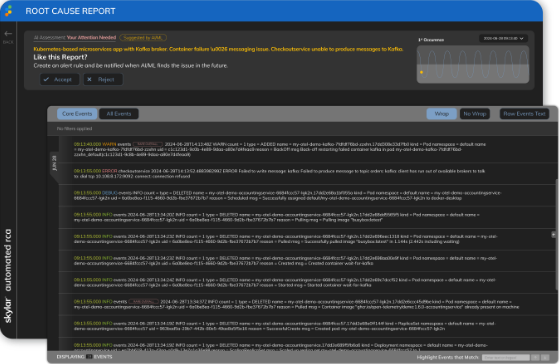
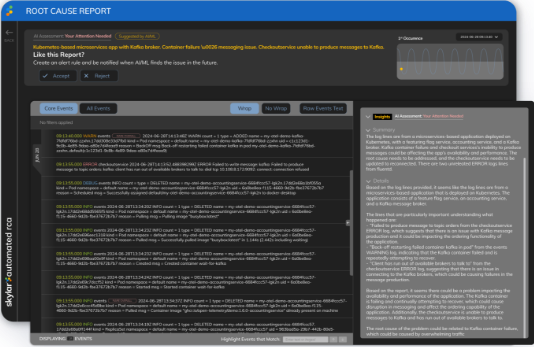
- GenAI summary and recommendations dramatically reduce time to understand what is actually broken.
- Processes vast volumes of logs in real-time to identify root cause with machine learning.
- No manual training required – unsupervised machine learning produces results in less than 24 hours.
Identify Unknown Unknowns Before They Cause Incidents
The complexity of modern applications makes it challenging for any person to know what could break at any given time.
- Catch new problems without manually building complex rules or scrolling through log data.
- Identify unusual or novel issues and associated root causes, even when you or your monitoring tool don’t know what to look for.
- Correlate unusual behavior with recent changes and performance metrics so you can understand potential business or service impact.
Understand What is Happening, Even if You Don’t Speak Log
Since logs vary widely, reading them is like decoding a foreign language – even for seasoned engineers. Words may look familiar, but each log has unique vocabulary and syntax.
- Distill billions of log lines down to the few most critical to isolate root cause.
- Get human-centric GenAI summaries and recommendations that understand your operations.
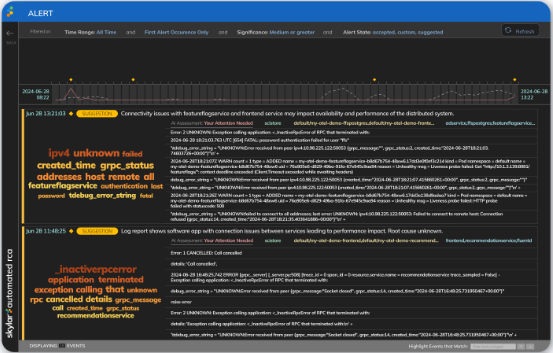
- Visualize the most important keywords from logs that describe the root cause.
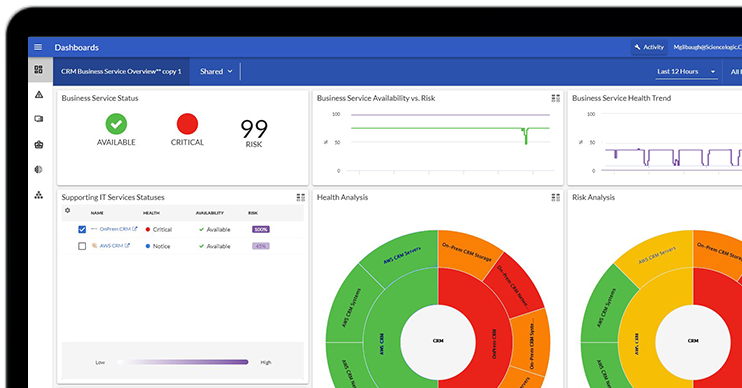
See SL1 + Skylar Automated RCA Wherever You Work
SL1 + Skylar Automated RCA

Ready to Get Started?
See how Skylar Automated RCA can save you time hunting through logs. Fill out this form to request your free onboarding session and 30-day trial.