
The Cisco Technical Assistance Center (TAC) has over 11,000 engineers handling 2.2 million Service Requests (analogous to incidents or support cases) a year. Although 44% of them are resolved in one day or less, many take longer because they involve log analysis to determine the root cause. This not only impacts the time a case remains open, but at Cisco’s scale, translates to thousands of hours spent each month analyzing logs.

Automation as the first line of defense
In addition to employing some of the industry’s most talented support engineers, Cisco TAC makes extensive use of automation and cutting-edge technologies such as Natural Language Processing to help engineers find relevant content to resolve customer issues based on the problem description and symptoms articulated in the case notes.
As a first step towards automated log analysis, when log bundles are received from a customer, they are scanned by a proprietary rule engine called BORG. BORG scans each log bundle against a set of known problem signatures to determine if there are any matches. Signatures can be as complex as pieces of code that cross reference multiple sources, or as simple as regex rules that search for occurrence of specific well-known patterns. The goal is to quickly see if a particular customer is experiencing a known problem for which a signature exists. If there’s a match, the case can be resolved quickly.
However, building and maintaining signatures manually is challenging. When a new type of problem is uncovered, it must be characterized based on how it appears in the logs. While this can be simple when there is a single log line that identifies the problem, it is often more complex (e.g. when a problem presents itself as multiple log events from multiple different sources that must occur within a period of time). This means, there is always a back log of signatures waiting to be created. In addition, maintaining and testing signatures is an ongoing burden because log formats and payloads can change in new software releases. Because of this, existing signatures can become outdated and stop providing alerts that engineers might have expected. This can result in false negatives that may lead an engineer astray.
In addition, using signatures to speed up problem resolution is not always possible. For example, sometimes a signature will only catch a symptom rather than its root cause. And since a single symptom could have many different causes, a support engineer must still analyze the logs to determine what happened. There is also a large class of problems that have never been seen before. In these cases, the only option is manual log analysis.
Manual log analysis is still necessary
Each month, Cisco engineers analyze over 20,000 log bundles to help resolve SRs. The analysis typically starts with searching around the time the problem occurred for error messages and keywords known to be related to the problem description. Tenured engineers, with experience troubleshooting a particular product, will also keep an eye out for rare or unexpected log lines which aren’t usually present. Depending on what is found, the search will often continue across multiple log files or even bundles and the engineers might need to correlate events from these logs to uncover important details. A common method of identifying problems is to compare logs from a working sequence and a non-working sequence, using the difference in the log lines between the two sequences as problem indicators. And depending upon the expertise required, the case might need to be escalated to a developer for further analysis. In some situations, custom scripts need to be written to extract and order a subset of log lines to make them “human legible”.
Overall, the “log hunting” process requires skill, intuition, and experience and can take significant time and resources. Finding the proverbial needle in the haystack whilst poring over esoteric log bundles is hardly anyone’s favorite way to spend their time!
In search of improvement: Could ML play a part in this process?
For several years, our team, the Innovation, Automation & Disruption Team within the TAC had been investigating the feasibility of using AI and ML to assist with log analysis. We were exploring both building a tool internally as well as any available commercial products.
In early 2021, we came across Zebrium. After seeing a demonstration, we decided to try Zebrium with a set of logs from one of our internal systems. Within minutes of ingesting the first log bundle, Zebrium generated a root cause report that contained the exact log lines that explained the root cause. This promising result allowed us to quickly gain approval to carry out a more extensive evaluation of the Zebrium technology.
The initial trial leveraged Zebrium’s SaaS offering, but for a more thorough proof of concept, we required a solution that could be easily used with static log bundles. Though originally designed to analyze log streams from live applications, the Zebrium ML engine works equally well on static log bundles.
When Zebrium ingests log data, its machine learning automatically learns the structure of each unique type of log line and, therefore, works well with unstructured logs of any format. All that Zebrium requires is that the logs be in plain text and that most lines contain a timestamp.
In the case of static log files, it’s important to send each file together with meta data about where the log came from (e.g. server name, container name, etc.) so that Zebrium can correctly identify correlations. When using streaming log files, this is taken care of automatically by the open-source log collectors.
Additionally, to avoid Cisco Customer data leaving Cisco premises, we also required an on-premises solution. Fortunately, Zebrium was in the final stages of making available it’s on-premises deployment option and was able to deliver this to Cisco in June 2021.
How to validate the efficacy of Zebrium’s ML technology?
The only way to realistically test Zebrium’s technology was to ingest customer logs obtained from actual customer Service Requests (SR is the term Cisco uses for a customer case) and see if Zebrium could assist in performing a through and accurate Root Cause Analysis. So, an experiment was devised to take historically solved SRs, containing log bundles and where the root cause was known, and ingest them into Zebrium. TAC subject matter experts would then be asked to use the incident reports generated by Zebrium to identify the root cause of the customer’s issue and compare the results with the already known root causes. To keep the experiment concise, but also validate the technology agnostic nature of Zebrium’s solution, it was decided to conduct this experiment with SRs from four different and disparate technologies and products. The experiment would be deemed successful if we were able to meet or exceed the following success criteria.
Success Criteria (actual results are further below):
- TAC SMEs were able to identify the correct root cause for the SRs from the incident reports generated by Zebrium at least 50% of the time.
- A minimum of 100 log bundles were analyzed
- TAC SMEs found the process of identifying the root cause using Zebrium simpler and more efficient than their current methods
Systematic testing of Zebrium ML for Logs using actual customer cases
As mentioned, for the Proof of Concept (POC), we focused on four very different product lines:
- Cisco Webex client
- Cisco DNA Center (DNAC)
- Cisco Identity Services Engine (ISE)
- Cisco Unified Compute Servers (UCS)
These products were specifically chosen because the log bundle structure, volume of logs in a bundle and the individual log formats varied significantly across each of them.
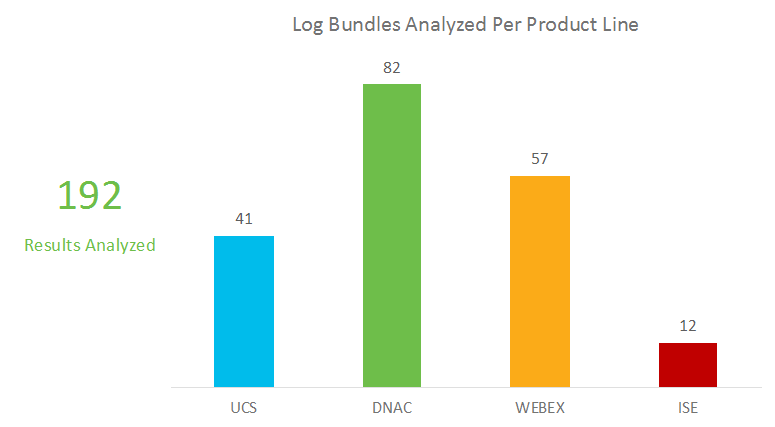
For each of these products, we selected historical Cisco Service Requests (SR) that had already been solved by Cisco TAC engineers. Each SR that was chosen contained notes that included the specific log lines that were identified by the engineer handling the SR as explaining the root cause. In total, 192 log bundles were analyzed as follows:
Once Zebrium was set up on an on-prem cluster, adapters were written for each product to ingest an entire log bundle for that product and forward it to the Zebrium ML engine. The adapters are designed to do the following:
- Use the SR number to let the ML know that all files from the bundle are related (Zebrium uses the term “service group” for this)
- Extract and decompress each file
- Identify and label the namespace to which events in the log files belonged (Zebrium uses the term “log basename” for this)
- Use the Zebrium API to send each file together with relevant meta data (its service group name, host name, log type, etc.)
- Normalize log lines with disparate structures (e.g. JSON dumps or stack traces) into unstructured text that looks and feels similar to regular log lines
After each bundle was ingested, the root cause report generated by Zebrium was perused by a TAC SME to identify the root cause and compare it against that identified by the original TAC SR owner.
- If the TAC SME was able to find an incident generated by the Zebrium ML that contained log lines matching those identified by the original SR owner as the root cause, the result was noted as “positive”
- If the TAC SME was able to identify an incident generated by the Zebrium ML that highlighted log lines different from what was identified by the original SR owner, but still with enough necessary detail and context to pinpoint the actual root cause, the result was noted as “positive”. It turned out that in some cases, Zebrium identified log lines with a clearer explanation of root cause than those identified by the original engineer!
- If the TAC SME identified a problem that was different from the reason the customer opened the original SR but was still pertinent to the customer and required fixing, it was considered a “Beyond the Fix” result. While this didn’t count to the success metric, it was still a positive outcome.
- If the TAC SME was unable to identify any incident that helped identify the root cause of the customer’s issue, the result was noted as “negative”
The results
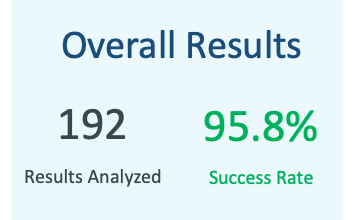
Across the 192 bundles that TAC SMEs were able to analyze during the period designated for the POC, Zebrium’s ML was able to correctly identify the results 95.8% of the time (a significant improvement over the success criterion of 50% accuracy).
Just as importantly, the user feedback from TAC SMEs, highlighted just how much of an improvement the addition of Zebrium made to the log analysis workflow:
“It was very easy to find the errors, they pop up immediately…I’ll find relevant logs much faster.”
“It's a really smart tool that can quickly narrow down problem error messages.”
“This is amazing to see. This wasn’t an easy issue and to see that [the ML] analysis was able to point us in right direction is very positive.”
“Zebrium added color to the drab black and white process of log analysis”
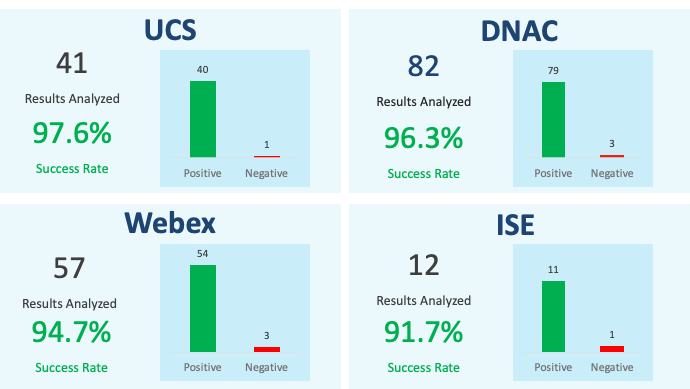
Following are the results for each of the four product lines:
Conclusion
In this detailed study of 192 actual customer Service Requests, Zebrium’s machine learning was able to correctly identify the root cause in 95.8% of the cases. User feedback praised the quality of the root cause reports and experienced significant time savings compared to manual log analysis.
As a result of this, at the time of writing, we are in the process of rolling this solution into production for use across an initial tranche of 8 product lines in TAC centers around the world.
It is believed that the addition of Zebrium’s machine learning to the existing TAC tool kit, will allow TAC to achieve a significant increase in case resolution times for SRs that require log file analysis. This will not only improve customer satisfaction but will also drive significant cost savings by slashing thousands of hours of time each month that would otherwise be spent manually analyzing logs.
