The best way to try Zebrium's machine learning is with an application that is experiencing a failure. This blog shows you how to spin up a single node Kubernetes cluster using Minikube, install a realistic demo app (Sock Shop), break the app using CNCF's Litmus Chaos engineering tool, and then see how Zebrium automatically finds the root cause of the problem.
Note: If you prefer to try this in AWS using EKS, please visit: https://aws.amazon.com/blogs/containers/autonomous-ml-based-detection-and-identification-of-root-cause-for-incidents-in-microservices-running-on-eks/
Quick aside: we're not using any smoke and mirrors here! The machine learning (ML) hasn't been pre-trained on Sock Shop logs, and there are no rules in place to catch the problem that we will induce. The entire Sock Shop environment takes about 15 minutes to set-up and we recommend leaving it running for only two hours to give the ML a chance to learn the "normal" patterns. That's all that is needed for Zebrium's ML to find the root cause when you break the app!
Enjoy the ride!
 The Sock Shop Demo Microservices App
1 - Install Minikube and Create a Kubernetes Cluster
We are going to use minikube so that you can deploy the Sock Shop app in a Kubernetes cluster running locally on your Mac, Windows or Linux PC. Note that the entire procedure below would also works in any other Kubernetes environment (I recently tried it with Amazon EKS).
- Instructions for installing minikube can be found here (there are also many good minikube tutorials available online).
- You'll also need to install helm if it's not already installed.
Start minikube with 7200MB RAM and 4 CPUs. Minikube supports a number of different drivers depending on your OS - see here. On a Mac, I recommend using the Hyperkit driver - see the example below. I got this to work on a Macbook Pro with 8GB of memory, but more memory would be better.
#For Mac:
minikube start -p sockshop --memory 7200 --cpus=4 --driver=hyperkit

#For Windows:
minikube start -p sockshop --memory 7200 --cpus=4 --driver=hyperv

#You can also use other drivers if necessary - see docs
2 - Sign-up for a Zebrium account and install the log collector
Sign-up for a free trial account here. After setting a password, advance to the “Send Logs” page.
--> Important: Do not install the log collector yet as we’re going to modify the install command!
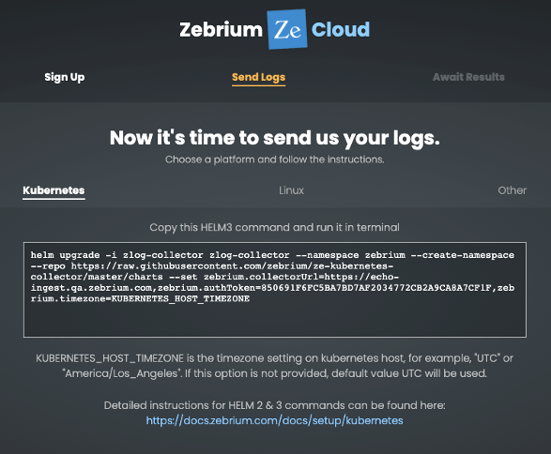
a) Copy the Helm command from the Zebrium “Send Logs” page. Paste the Command into a shell window and delete the part of the line that sets timezone:
zebrium.timezone=KUBERNETES_HOST_TIMEZONE
See the example below (make sure to substitute XXXX for your actual token)
# Install the Ze log collector. Copy the cmds from your browser & make the above changes. Make sure you use the correct token and URL

helm upgrade -i zlog-collector zlog-collector --namespace zebrium --create-namespace --repo https://raw.githubusercontent.com/zebrium/ze-kubernetes-collector/master/charts --set zebrium.collectorUrl=https://cloud-ingest.zebrium.com,zebrium.authToken=XXXX
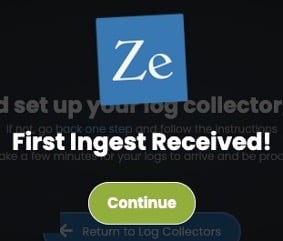
After about a minute, the Zebrium UI should detect that logs are being sent. You’ll see a message like this:
Because this is a demo environment, we’re going to adjust some settings. The default settings are designed to work well for most production environments. However, to compensate for the short run time and small amount of data that will be generated in this demo environment, we recommend changing the following settings.
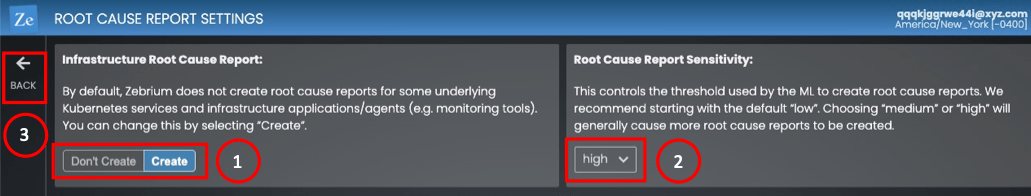
Hit “continue” and then in the menu in the top right corner, select “Root Cause Settings”:
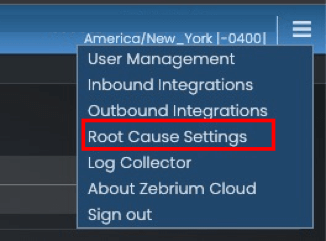
Set the following (see picture below):
- Set Infrastructure Root Cause Reports to “Create”.
- Set Root Cause Sensitivity to “High”
- Click the “Back” button to return to the log collector installation page
That's it for the Zebrium setup. The machine learning is now busy structuring and learning the patterns in the logs from your newly created K8s environment.
4 - Install the Sock Shop app
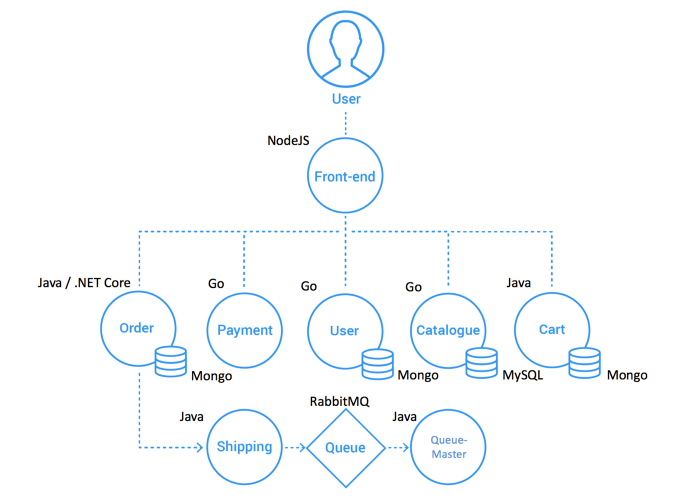
The Sock Shop app emulates the front-end of an e-commerce website. It's deployed across 14 pods (this includes a load generator). The following picture shows a high-level architecture of Sock Shop:
We're going to install Sock Shop using a YAML config file that includes annotations for the Litmus chaos engine that we will later use to break the app.
# Install Sock Shop from yaml. This version of the yaml has Litmus chaos annotations.

kubectl create -f https://raw.githubusercontent.com/zebrium/zebrium-sockshop-demo/main/sock-shop-litmus-chaos.yaml
Wait until all the pods are in a running state (it took about 6 minutes on my laptop).
# Check if everything has started - this can take a few minutes. Keep checking and don't move on until all pods are in a running state

kubectl get pods -n sock-shop

NAME                            READY   STATUS    RESTARTS   AGE
carts-79f5dd46bb-dvfpn          1/1     Running   0          6m14s
carts-db-69669d85b8-w9m9v       1/1     Running   0          6m13s
catalogue-7f567b89ff-whl8t      1/1     Running   0          6m13s
catalogue-db-64bbcd4bf-6tb5n    1/1     Running   0          6m14s
front-end-7db75779b6-fdfnx      1/1     Running   0          6m13s
orders-7f966b7dcc-nvrmd         1/1     Running   0          6m13s
orders-db-7c64447b77-lgvmb      1/1     Running   0          6m13s
payment-845b744cdf-9f7ct        1/1     Running   0          6m12s
queue-master-798897f97b-9xc8c   1/1     Running   0          6m12s
rabbitmq-66bf858977-hnqj2       1/1     Running   0          6m12s
shipping-77cd4d7cf5-wcx96       1/1     Running   0          6m12s
user-5f858cb484-dvr8j           1/1     Running   0          6m11s
user-db-57d4bd5d56-2vt56        1/1     Running   0          6m12s
user-load-59b58b868f-cfg5c      1/1     Running   0          6m11s
5 - Get the IP Address of the front-end
Once all the services are running from the step above, you need to get the IP address and port of the front-end so that you can access the app in your browser. The process to do this will depend on your minikube driver and network setup.
For macOS using hyperkit - Get the minikube IP address and use port 30001:
# macOS and Hyperkit use the ip address below with port 30001

minikube ip -p sockshop
192.168.64.105

# URL to use would be: http://192.168.64.105:30001/
If using the Docker driver - Open a new terminal window (it will need to remain open), and run the following command to create a tunnel and get a URL:
# Docker driver (this example is on macOS)

minikube service front-end --url -n sock-shop -p sockshop

🏃  Starting tunnel for service front-end.
|-----------|-----------|-------------|------------------------|
| NAMESPACE |   NAME    | TARGET PORT |          URL           |
|-----------|-----------|-------------|------------------------|
| sock-shop | front-end |             | http://127.0.0.1:58263 |
|-----------|-----------|-------------|------------------------|
http://127.0.0.1:58263
❗  Because you are using a Docker driver on darwin, the terminal needs to be open to run it.

# URL to use would be: http://127.0.0.1:58263
Note: On some platforms you may need to run the command "minikube tunnel -p sockshop" to create a tunnel. If so, do this in a separate terminal window. Check the minikube docs if you're not sure of the best way to expose the front-end pod.
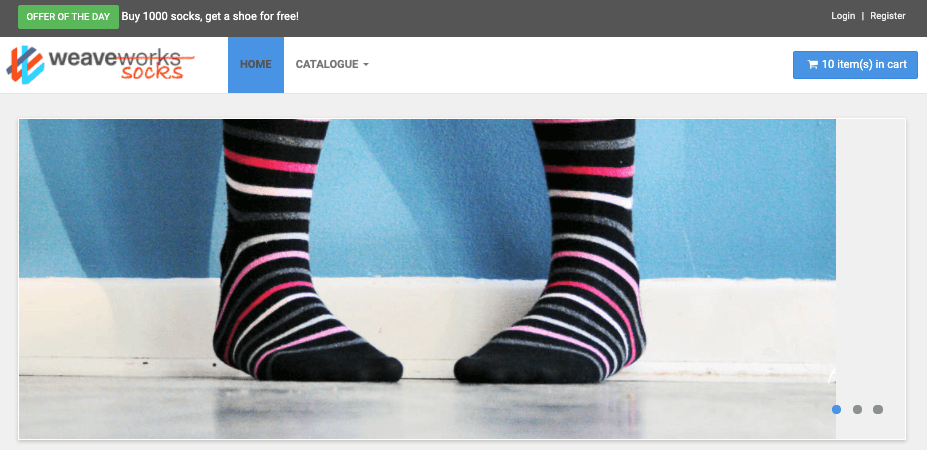
Now open the URL form above in a web browser tab, and you should see the Sock Shop app:
The Sock Shop Demo Microservices App
6 - Install Litmus Chaos Engine
We're going to use Litmus to break the app, so let's install the required Litmus components:
# Install Litmus and create an appropriate RBAC role for the pod-network-corruption test

helm repo add litmuschaos https://litmuschaos.github.io/litmus-helm/

helm upgrade -i litmus litmuschaos/litmus-core -n litmus --create-namespace

kubectl apply -f https://raw.githubusercontent.com/litmuschaos/chaos-charts/v1.13.x/charts/generic/experiments.yaml -n sock-shop


# Setup service account with the appropriate RBAC to run the network corruption experiment

kubectl apply -f https://raw.githubusercontent.com/zebrium/zebrium-sockshop-demo/main/pod-network-corruption-rbac.yaml


# Make a note of the time

date
7 - Do something else for about two hours!
This is a brand new K8s cluster, app installation and Zebrium account, so it's important to give the machine learning some time to learn the normal log and metric patterns. We recommend waiting about two hours before proceeding (you can wait longer if you like).
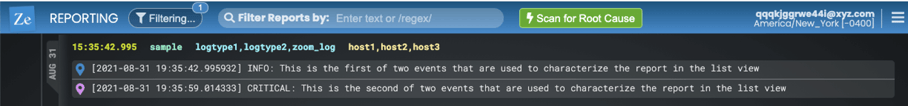
During this time, feel free to explore the Zebrium UI. On the “REPORTING” page, you should see at least one Sample root cause report. Click on the sample report as it will help you learn how to use the UI. You will likely also see a few other root cause reports that relate to clusters of anomalies in the logs that occure during the bring-up of the new app and K8s cluster.
8. Break the Sock Shop App Using the Litmus Chaos Engine
After a couple of hours, the ML will have had a chance to get a baseline of the normal patterns in the logs, so it's now time to break the environment by running a Litmus network corruption chaos experiment. Details of what the experiment does can be found here.
The following command will start the network corruption experiment (it's worth noting down the time that it runs):
# Run the pod-network-corruption test
kubectl apply -f https://raw.githubusercontent.com/zebrium/zebrium-sockshop-demo/main/pod-network-corruption-chaos.yaml

date
On my laptop, it took about a minute for the test to start. You'll know the chaos experiment is running when the pod-network-corruption-helper goes into a Running state. You can monitor its progress with kubectl (the -w option waits for output, so hit ^C once you see that everything is running):
# Watch the output until pod-network-helper goes into Running state
kubectl get pods -n sock-shop -w
....

sock-chaos-runner                      0/1     Pending             0          0s
sock-chaos-runner                      0/1     Pending             0          0s
sock-chaos-runner                      0/1     ContainerCreating   0          0s
sock-chaos-runner                      1/1     Running             0          13s
pod-network-corruption-qggdmo-m4fpg    0/1     Pending             0          0s
pod-network-corruption-qggdmo-m4fpg    0/1     Pending             0          0s
pod-network-corruption-qggdmo-m4fpg    0/1     ContainerCreating   0          0s
pod-network-corruption-qggdmo-m4fpg    1/1     Running             0          47s
pod-network-corruption-helper-hhopwy   0/1     Pending             0          0s
pod-network-corruption-helper-hhopwy   0/1     ContainerCreating   0          0s
pod-network-corruption-helper-hhopwy   1/1     Running             0          10s
....

#Hit ^C to stop the kubectl command
Once the chaos test is actually running, you can go to the Sock Shop UI. You should still be able to navigate around and refresh the app, but if you add anything into the shopping cart, you might see that the number of items does not increment correctly (it might catch up when the chaos test finishes). The chaos test will run for 2 minutes.
9. The results and how to Interpret Them
I tried the above steps a few different times. Each time, Zebrium produced a pretty awesome root cause report. But it was different in each case because the exact log lines and their order vary depending on your environment and the timing of all the operations and events.
After you run the chaos experiment, it will only take a few minutes for Zebrium to detect the problem (typically 2-6 mins). The Reporting screen doesn't automatically refresh so give it a few minutes and then refresh your browser. You should see one or more new root cause reports appear.
--> Important: If you don’t see a relevant report, or the report doesn’t show you root cause indicators of the problem, read the section below “What Should I do If there are No Relevant Root Cause Reports”.
Following is an example from one of my runs. It's worth reading the details as they will help you interpret the results when you try this on your own.
The Reporting Page - We See The First Clue
In the Reporting page you will see a summary view of all root cause reports. The screen shot below is the new one I saw after running the chaos test and then refreshing the browser window:
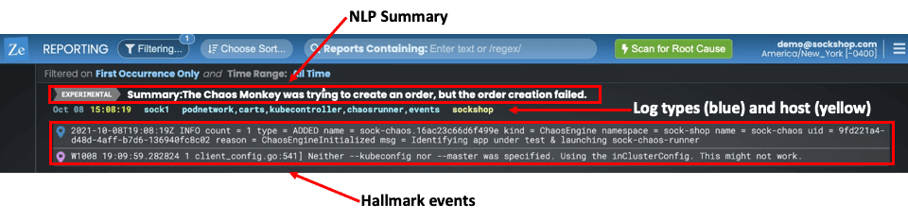
I've highlighted the three important things you will see:
- A Plain language NLP summary – This in a new experimental feature where we use the GPT-3 language model to create a summary of the root cause report. The GPT-3 results aren't always great, but this one is fairly close to what happened - it gives the sense that a chaos tool impacted the creation of an order.
- The log type(s) and host(s) - You can see the host name ("sockshop" in yellow) and log types (podnetwork, carts, kubecontroller, chaosrunner and events) contained in the report. These logtypes each have one or more correlated anomalies that the machine learning has picked out.
- The Hallmark Events - The ML picks out one or two events that it thinks will characterize the problem. In this example one of the hallmarks is a chaos engine initialized event.
Viewing The Relevant Root Cause Report Shows The Actual Root Cause
Clicking on the summary lets you drill-down into the actual root cause report. The report contains the "core" set of log events that the machine learning has picked out (i.e. the set of correlated anomalies it found across all the logs). In this example, there are just 23 events it picked from the hundreds of thousands that were generated while the chaos test was running.
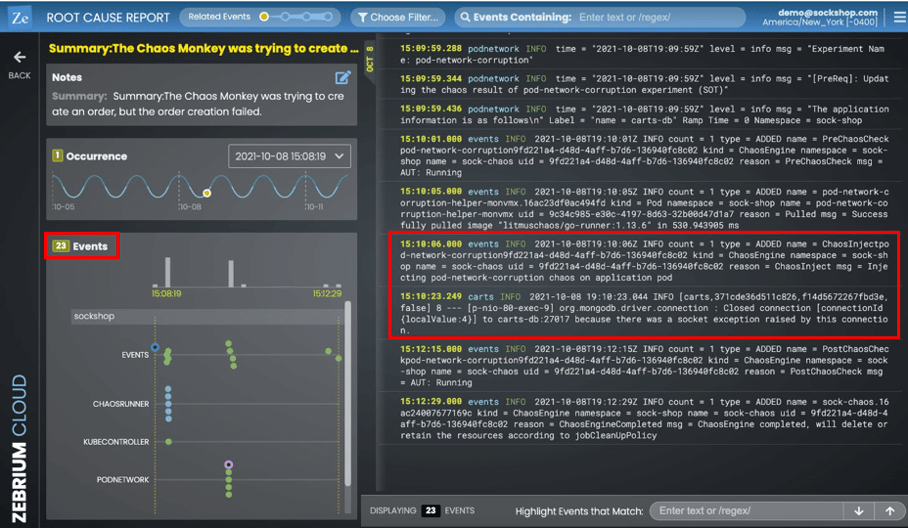
Of the 23 events, most are relevant to what happened but I've highlighted two of them, because they provide a good summary:
events - 2021-10-08T19:10:06Z INFO count = 1 type = ADDED name = ChaosInjectpod-network-corruption9fd221a4-d48d-4aff-b7d6-136940fc8c02 kind = ChaosEngine namespace = sock-shop name = sock-chaos uid = 9fd221a4-d48d-4aff-b7d6-136940fc8c02 reason = ChaosInject msg = Injecting pod-network-corruption chaos on application pod
carts  - 2021-10-08 19:10:23.044 INFO [carts,371cde36d511c826,f14d5672267fbd3e,false] 8 --- [p-nio-80-exec-9] org.mongodb.driver.connection : Closed connection [connectionId{localValue:4}] to carts-db:27017 because there was a socket exception raised by this connection.
The first, from the "events" logtype, indicates the pod network corruption chaos experiment is being injected. Very soon after, the second event in logtype "carts" shows where the carts service gets an exception because it has been impacted by the injected network problem.
Why This Is Really Cool
These 23 events were picked out from several hundred thousand that were generated while the experiment was running. They provide a great narrative of what happened and didn't require any manual hunting! And remember, the machine learning found them without any knowledge of the application or environment and without any manually built rules.
Related Events Let you Explore in More Detail
The root cause report starts with the core set of events picked out by the machine learning. However, there is an easy way to see other potentially related errors and anomalies.
At the top of the screen, you will see the Related Events Zoom buttons:

Click the second yellow dot to zoom out to the next level:

In my example, it showed me something really interesting.
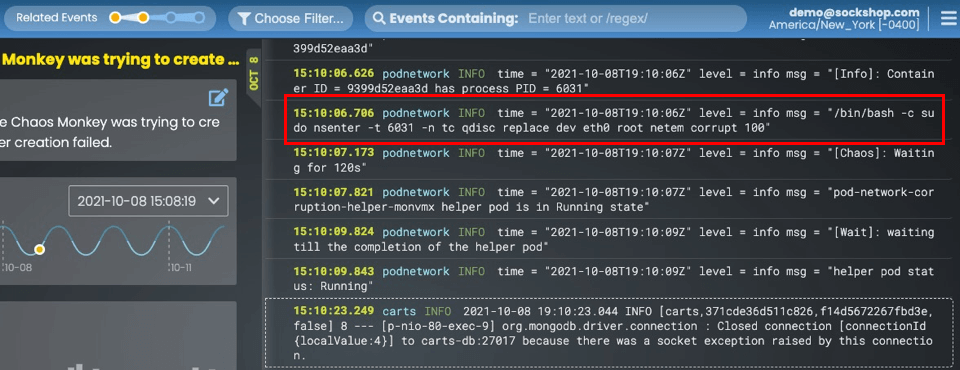
Five lines above the carts event, you can see the actual command that the chaos experiment ran to corrupt the network port!
There's also one more useful feature when exploring a root cause report:
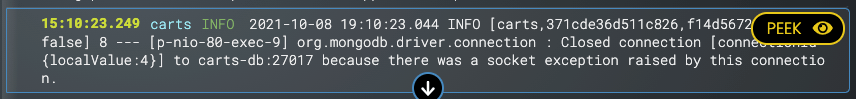
If you move your mouse the the right hand part of any event, you will see the "PEEK" button. Clicking it takes you to an excerpt of the actual source log stream that the event came from. This is useful to see what else was going on in that particular log.
What Should I do If there are No Relevant Root Cause Reports?
Although this is a test environment, there is a lot going on. There are ~40 different log types from ~25 pods, producing a total of over a million log events each hour! The exact timing, order of log events and types of events produced will vary by run and environment. This means that in some cases, the machine learning might not automatically create a relevant root cause report.
You might also find that the ML uncovers other problems that don't directly relate to the chaos experiment. For example, during one of my runs, my PC was low on resources and the ML picked out a bunch of Kubernetes related problems.
The good news is that even if you don’t initially see something relevant, there are a few things that you can try:
a) Related Events Zoom and Peek - See details above for information on how to use Peek and Related Events Zoom. These can be extremely useful if the core events of a root cause reports don't explain the problem. The root cause details are often just a click or two away!
b) Scan for Root Cause – If none of the existing reports contain relevant information after zooming/peeking, you can explicitly tell the machine learning to scan for a problem around a particular time. In the Reporting page, there is a green button at the top:

Clicking on this will pop up a time/date picker. You can then select an approximate time of the problem you’re looking to troubleshoot. The results of the scan should produce one or more new relevant root cause reports within a few minutes. Important: remember to refresh the screen to see any new reports.
c) Contact Zebrium - There are a few other setting that can be changed that can help to create the best possible root cause reports. Please don’t hesitate to contact Zebrium at hello@zebrium.com for help with this.
9. Optional Clean-up Of The Minikube K8s Cluster
When you're done with testing, you can delete the entire minikube K8s cluster with the following commands. Warning, you can't undo this step!
# Stop and delete the minikube K8s cluster - WARNING: you can't undo this!
minikube stop -p sockshop
minikube delete -p sockshop
Summary
The above steps provide an easy way to test and validate Zebrium's machine learning technology. To recap:
- We built a single node Kubernetes cluster using minikube
- We installed the Sock Shop app, Zebrium fluentd log collector and the Litmus Chaos Engine
- We ran a pod network corruption chaos experiment to simulate a real-life application failure
- Without any rules and with only two hours of baseline unsupervised learning, Zebrium created a reoot cause report with a small set of relevant log lines (out of the millions that were generated) which explained the root cause of the problem we created!
More importantly, Zebrium is even more compelling when used with real applications. The machine learning will both proactively detect new/unknown issues without requiring rules as well as find the root cause of any kind of software failure. More detail about how the ML works can be found here.
Now that you have a trial account, we encourage you to continue exploring the Zebrium platform. But really the best way to see it in action is to try it with your own applications.