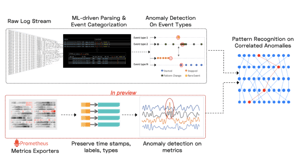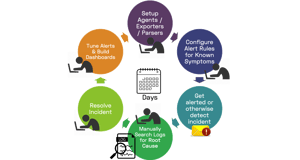
We believe the future of monitoring, especially for platforms like Kubernetes, is truly autonomous. Cloud native applications are increasingly distributed, evolving faster and failing in new ways, making it harder to monitor, troubleshoot and resolve incidents. Traditional approaches such as dashboards, carefully tuned alert rules and searches through logs are reactive and time intensive, hurting productivity, the user experience and MTTR.
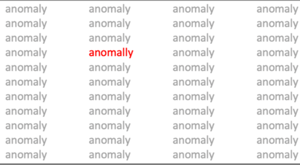
We believe the future of monitoring, especially for platforms like Kubernetes, is truly autonomous. Cloud native applications are increasingly distributed, evolving faster and failing in new ways, making it harder to monitor, troubleshoot and resolve incidents. Traditional approaches such as dashboards, carefully tuned alert rules and searches through logs are reactive and time intensive, hurting productivity, the user experience and MTTR. We believe machine learning can do much better – detecting anomalous patterns automatically, creating highly diagnostic incident alerts and shortening time to resolution.