
The Elastic Stack (often called ELK) is one of the most popular observability platforms in use today. It lets you collect metrics, traces and logs and visualize them in one Kibana dashboard. You can set alerts for outliers, drill-down into your dashboards and search through your logs. But there are limitations. What happens when the symptoms of a problem are obvious – say a big spike in latency, or a sharp drop in network throughput - but the root cause is not as obvious? Usually that means an engineer needs to start scanning logs for unusual events and clusters of errors, to understand what happened. The bottleneck isn’t the speed of the Elastic queries – it is the human not knowing exactly what to search for, the time it takes to visually spot outliers and the hunt for bread crumbs that point to suspected problems.
When Seagate’s Lyve Cloud service experienced a 24 hour outage during stress testing (prior to going into production), engineers became aware of the problem quickly, but then spent hours searching logs trying to spot outliers that explained the root cause. With thousands of log streams across dozens of micro-services, it was really hard to pin-point where the problem started, and how it rippled through services.
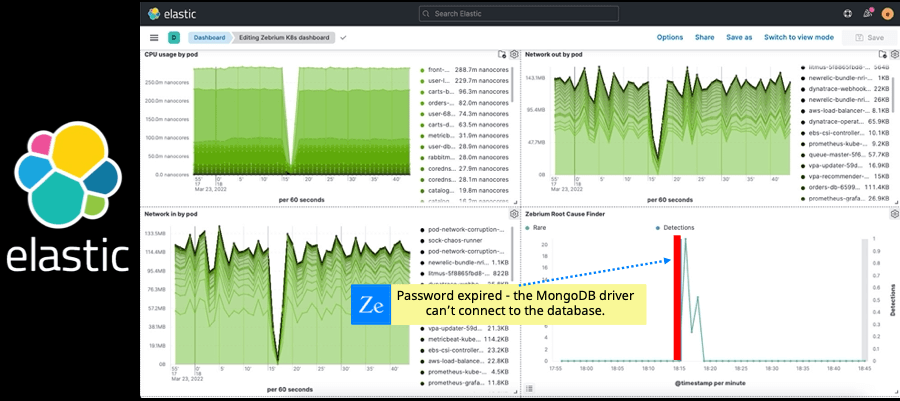
Now imagine a machine learning (ML) engine that emulates a team of experienced engineers. It is able to spot outliers as well as a trained human, just much faster. It also correlates outliers across log streams much faster than human eyes can, re-tracing the timeline of the problem as it cascaded across software components. The end result is a short summary of a handful of log events (picked out from tens of millions) that describe the chronology of the problem. And the summary is lined up in time exactly with the spike or dip in your dashboard. Finally imagine that the engine is about as accurate as humans, and is lightweight enough to analyze terabytes of log streams in near real time without breaking the bank.
Well, Zebrium's Root Cause as a Service is real. It has successfully root caused thousands of incidents, and been validated in dozens of software stacks. In fact, Cisco did an intensive study comparing human generated results with Zebrium’s ML output across very diverse software families, and found that Zebrium achieved an accuracy rate of 95.8%. In other words, when a skilled engineer identifies a couple of log events as the best indicators of root cause – there is a 95% chance this technology will find the same events.
How Zebrium Root Cause as a Service Works with the Elastic Stack
It is really simple to add this capability to your Elastic environment:
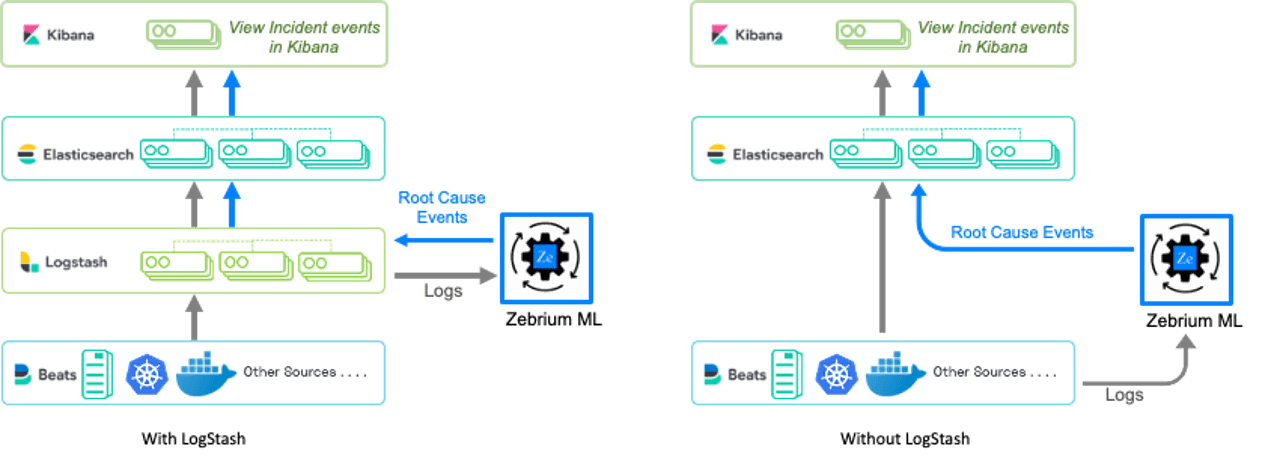
- Send your logs to Zebrium: If you use the ELK stack, you can send streams of logs into the Zebrium engine by configuring a Logstash output plugin to fork a copy to Zebrium. If you do not use LogStash, you can use open source log collectors to stream logs from your application and infrastructure.
- The Zebrium ML engine does not retain logs – it simply analyzes the streams, identifies the key events, summarizes them using NLP, and then sends the findings back to the Elastic stack.
- The Zebrium ML engine does not retain logs – it simply analyzes the streams, identifies the key events, summarizes them using NLP, and then sends the findings back to the Elastic stack.
- See results in Kibana: There are 2 ways to send the Zebrium findings back into Elastic – by using the lightweight zebeat agent, or by configuring an input plugin directly in Logstash.
Aren’t there already ML Add-Ons for Elastic (Elasticsearch Machine Learning)?
Because the problem of log-based troubleshooting has been around since the dawn of software, there have been multiple attempts to emulate the human driven troubleshooting process for logs. Most approaches try to classify log events using string matching techniques, and then surface rare events. Unfortunately, such techniques need a lot of examples of each unique event type to classify them accurately. But in the real world, the events most likely to explain root cause tend to be rare. So in practice these approaches aren’t able to cleanly classify the most useful events, and consequently they generate noisy dashboards with hundreds/thousands of “potential” anomalies. In effect using these legacy approaches end up being as time consuming as the brute force approach. In addition, most other approaches do not attempt to find anomaly correlations within and across the logs, and so are unable to use those correlations to generate concise root cause reports.
Zebrium’s approach is different. It starts with a more sophisticated approach to event classification that works well even for rare events. It then further separates signal from noise by identifying correlated events across log streams, resulting in a drastically smaller list of events to read (by 3 orders of magnitude). Finally, Zebrium summarizes the findings in natural language, using word clouds and GPT-3, to make them even more readable. You can see a comparison of Zebrium with Elasticsearch Machine Learning here.
How You Can Try This
Simply create a free trial account on our SaaS service: https://cloud.zebrium.com/auth/sign-up, connect it to your Elastic environment and see the results in Kibana in less than an hour. In short, when you see a problem on one of your dashboards, just look at the corresponding Zebrium panel and you'll see the root cause (no digging or drilling-down needed).
If sending logs to a SaaS service is a challenge for your team, you can register for the on-prem version of the same software here.
If you're interested in trying this with your own data, you can sign-up for a free trial at www.zebrium.com.

