
If you are a New Relic user, you’re likely using New Relic to monitor your environment, detect problems, and troubleshoot them when they occur. But let’s consider exactly what that entails and describe a way to make this entire process much quicker.
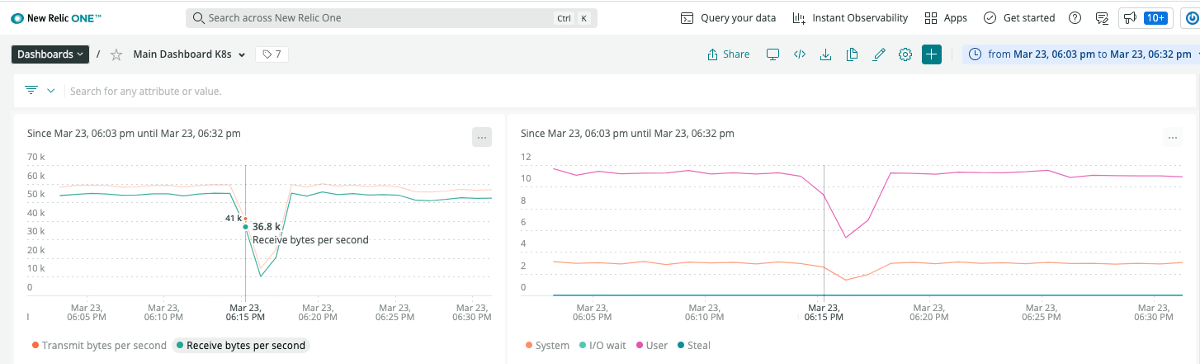
Imagine that the dashboards used to monitor your application suddenly show a “blip”. CPU and memory usage just fell off a cliff, as did network throughput. Resource utilization was comfortably healthy and throughput didn’t show any sudden spikes prior to the problem.
The Typical Manual Troubleshooting Process
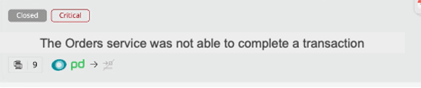
A bunch of alerts did go off, and New Relic’s AI features bucketed them all together, so all the problems seem related to one issue. But it doesn’t tell you what caused the issue.
In summary, your Golden Signals are showing latency is up, but traffic, saturation and errors didn’t show abnormal spikes, so there aren’t any obvious root cause indicators.
It’s been said that when dealing with software problems, you use:
- Metrics to know “when” something is wrong
- Traces to narrow down “where” the problem lies
- Logs to figure out “what” is wrong
Clearly, New Relic did its job with #1. It also helped with #2, although in this case the problem was so pervasive that it didn’t narrow the problem down to a particular service.
So, you reluctantly start looking at the logs. Error count didn’t show any big jump, so you’ll have to do this the hard way – you open your log viewer, zoom in on the time and environment where the problem occurred, and start looking around for errors or other unusual events that explain what happened.
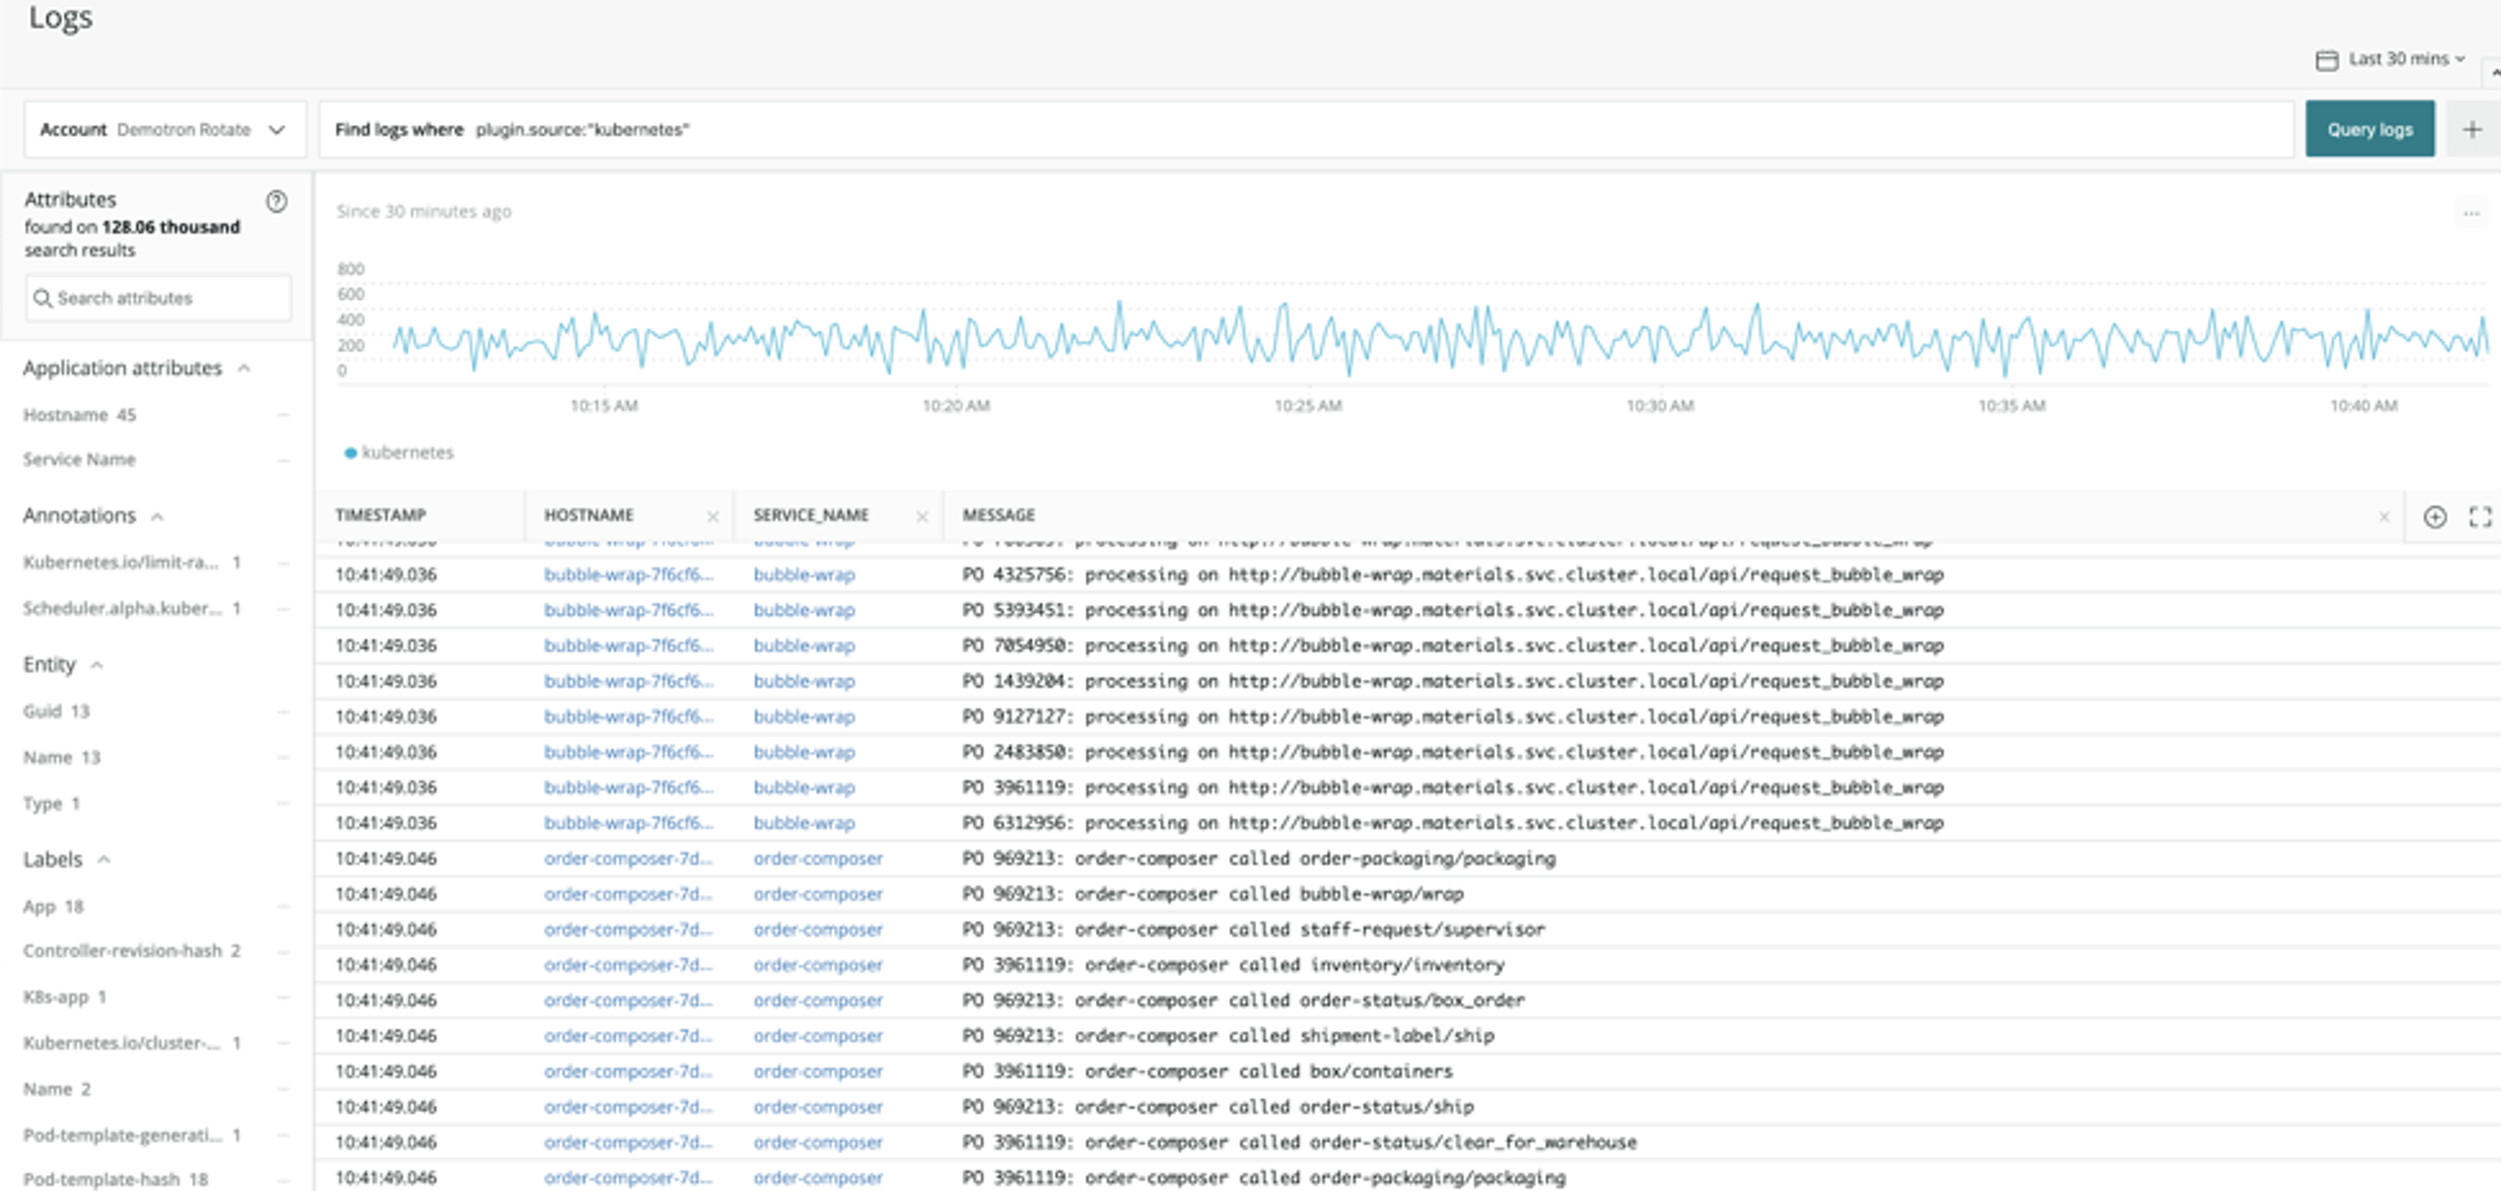
You see a cluster of errors around the time of the blip, but they’re just the symptoms - complaining about failed transactions and timeouts. So, you spend an hour working backwards from there – and you finally spot a smoking gun – a benign looking event that changed network settings. Sure enough – someone inadvertently “broke” the network. You keep checking to make sure there aren’t other unexpected events, and finally conclude this was the root cause. Total time taken 1.5 hours. You close the incident with your notes.
There is a better way
Imagine software that could self-train on the normal event patterns of your environment, and spot the same clusters of rare errors or warnings that a skilled engineer would. And, crucially, could also spot the outlier event(s) that actually triggered the whole problem, much faster than human eyes could. And what if all of this showed up automatically in your New Relic dashboard, lined up right below those unexplained blips?
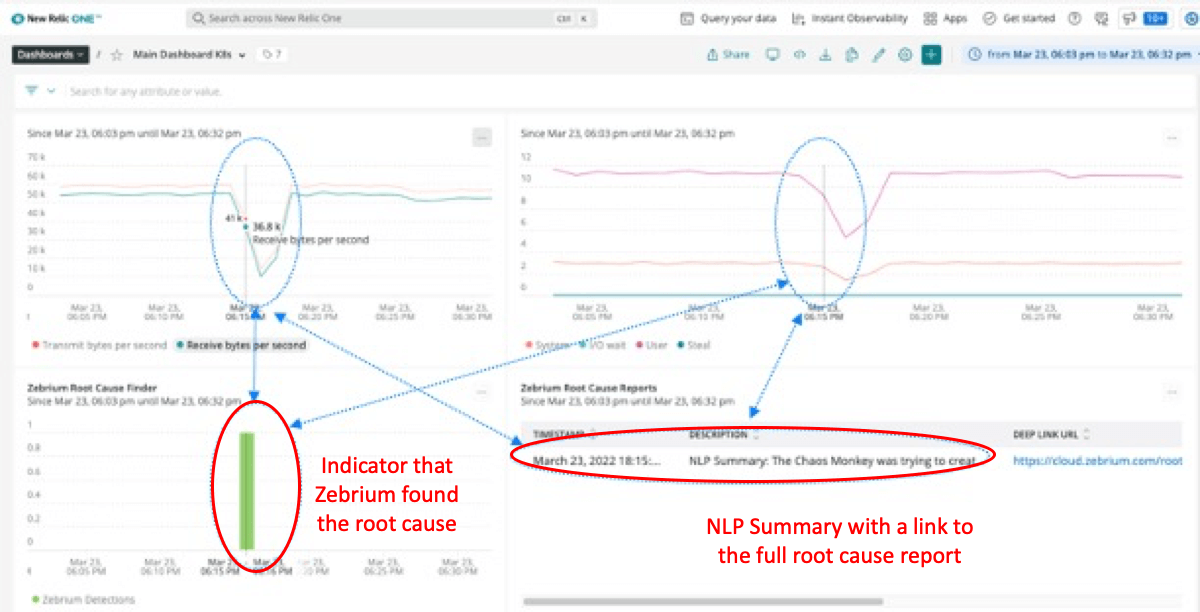
You’re probably skeptical. But what if it were accurate in picking up the events described above? And concise - just a handful of events, plus auto-generated natural language summaries (as opposed to searching millions of events, or even scrolling through hundreds of “anomalies” as some other machine learning approaches require you to)? This is what Root Cause as a Service offers you, and it has been validated to achieve over 95% accuracy.
But, we encourage you to be skeptical. So why not try this with your own data and see the results. It's easy to sign up, achieves good signal to noise within hours, and is free to try for 30 days.

