
More than two years ago, the Zebrium UI team embarked on designing an experience around our Machine Learning (ML) engine, which was built to find the root cause of critical issues in logs so users wouldn't have to. We knew our approach could cut Mean Time to Resolution (MTTR) from hours to minutes. But the idea of ML was foreign to users coming from the logging world, people who often relied on clever manual searching to do their jobs. To make them comfortable, our UI was built as a log viewer with ML features added around it. We had good success with that approach. But the utility of our UI was often measured by the quality of our search capability, not the quality of our ML. It wasn't until we focused the UI on what we do best, root cause detection through ML, that our users fully understood our value proposition... and the root cause experience was born!
Root cause report summary list
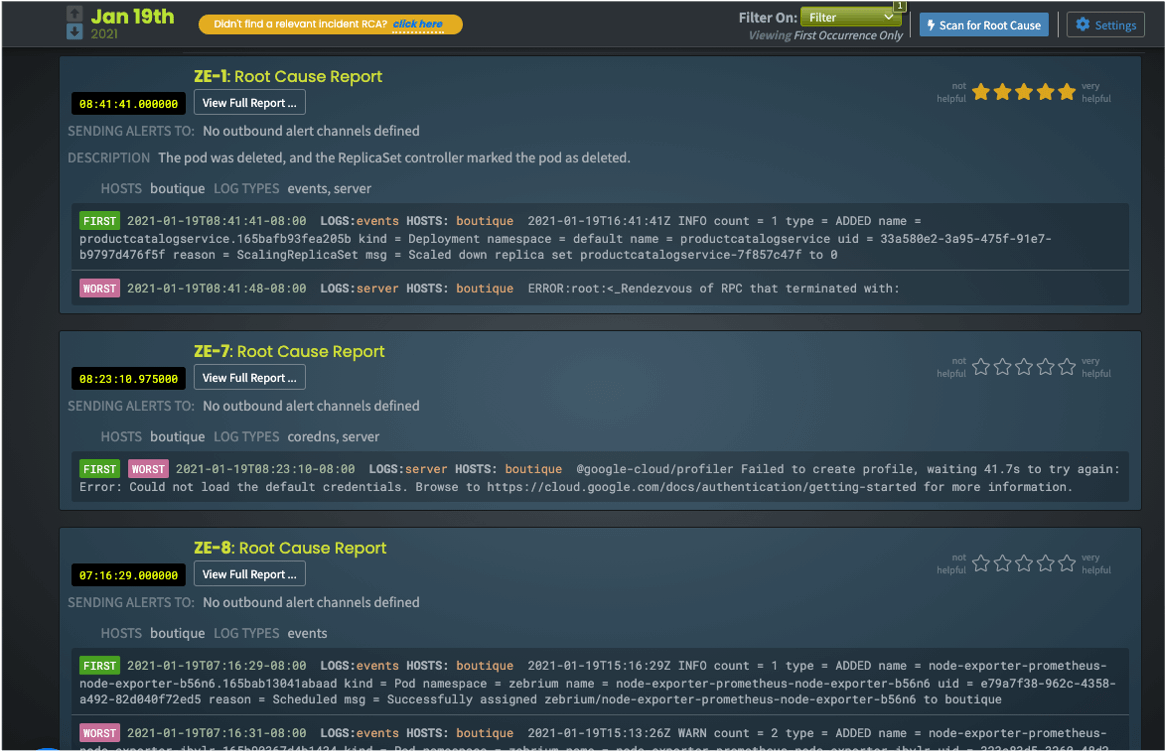
In our UI, the user enters the experience by viewing a list of root cause report summaries. The summaries give a high-level idea of each issue we've discovered and what log types and hosts are involved. It also backs up the report with what our ML believes is the first event in the chain of anomaly (usually a root cause indicator), along with the likely worst event, the flashpoint (usually a symptom). To further aid the user, we send our root cause reports through the GPT-3 engine, to provide natural language summarization of what is going on. We lay out reports in time order, most recent first, and as you'd expect, users can freely filter them on log type, host, owner (if you've assigned one) and so on.
This part of the UI serves two functions:
- If the user knows that a problem occurred and wants to find root cause, they simply click on the relevant report.
-
If a user wants to look for new failure modes or latent problems, this UI is great for proactively scanning and triaging issues before they impact production.
The next step is to drill down from the summary to the full report.
The root cause report

The root cause report seamlessly integrates log analysis tools with Zebrium's ML-driven root cause. It has two main sections. In the left pane we provide all the supporting evidence for the root cause, as well as a place for team members to write notes and set alerts if the issue happens again. In the right pane we provide a full-featured log viewer along with a heat-map timeline that focuses attention on where in the logs the anomalies live.
The event graph
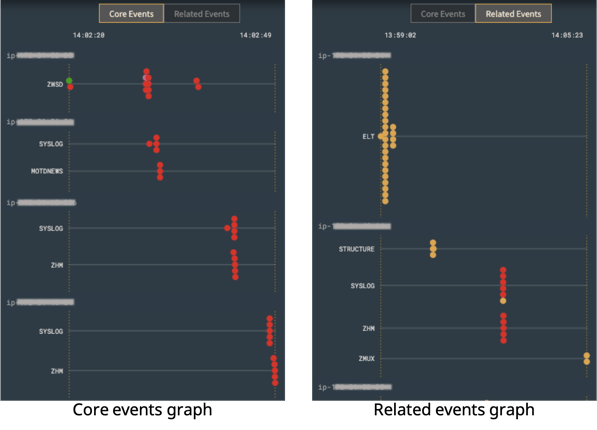
In the root cause report, the event graph is often where users start their exploration. Initially, they see Core Events, the likely explanation of the issue. Each event is displayed as a dot and is color-coded to represent its type then placed along a timeline. The timeline is further broken down by host and log type. Through this visualization you can rapidly judge how earlier events (those on the left) may have triggered later ones and, more broadly, you can easily see how issues in your infrastructure cascade over time. Rolling over any event dot reveals the full event log line in a tooltip and clicking the dot navigates you to that event in the log viewer. The log viewer displays all the events that make up the report. First and worst events are also color-coded and present in the timeline to act as focal points for your exploration.
Should you want, you may cast a wider net by clicking on the Related Events button. This increases the window of time surrounding the core events and consequently gathers and displays other events that may provide clues as to what happened.
The occurrences graph
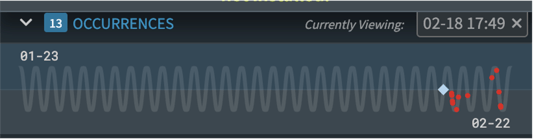
Some issues occur frequently, and the occurrences graph displays each one as a dot placed on a compact, snaking timeline. Each full wave in the snake represents a 24 hour period and all occurrences of the issue are graphed across your entire retention period. The snake can help you see patterns over time at a glance. In some cases issues occur at regular intervals. In other cases, they only occur at certain times of day or may have just recently started to occur. Each of those patterns offer clues as to the source of the issue. Have I introduced faulty code? Is an ill-timed cron job depleting system resources? And so on. The answers are in the logs and each occurrence can be navigated to and investigated by clicking on its dot.
Manage alerting

With root cause detected, analyzed, confirmed and resolved, you may want to define which teams should be alerted the next time we see this type of incident. You can do this in the managing alerts section without ever defining a rule, because that rule is already written for you by the ML engine. If the issue is urgent and you want to immediately alert a team without waiting for Zebrium to detect another occurrence of this incident, that's possible too.
General section
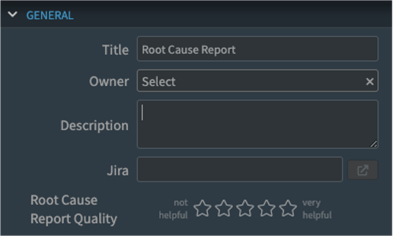
The last element of the report is the general section, where users can write notes about their investigation, assign owners to them, rate the root cause report quality and link out to ticketing systems like Jira.
On-demand scan for root cause
The Zebrium ML engine continuously scans incoming log and metrics stream for patterns that indicate a problem, and proactively generates a root cause report when it finds something relevant. However, there are situations where you may want to perform a deeper, on-demand scan. For example, perhaps your user base is hammering your call center about a condition that needs immediate resolution. Where to start? That's easy, if you don't already see a related report, just click the Scan for Root Cause button, provide the time of the issue and our ML will perform a deep scan of your logs and metrics and report what it finds.
Summary
Our users tell us that Zebrium's Root Cause experience is a game-changer. Our technology has been put through its paces across hundreds of application stacks, and we find that our ML-based approach replaces most of the tedious work involved in combing through huge volumes of logs looking for the source of problems. In practice, Zebrium helps teams reduce MTTR by as much as 90%.
We encourage you to give our root cause reports a try and let us know what you think. Please sign-up for a free trial by visiting www.zebrium.com. If you don't have an environment to try Zebrium, you can spin up a sample microservices demo app and see all of this for yourself in just a few minutes.

