
A few months ago, our friends at Maya Data joined our private Beta to give our Autonomous Log Monitoring platform a test run. During the test, they used their newly created Litmus Chaos Engine to generate issues in their Kubernetes cluster, and we managed to detect all of them successfully using our Machine Learning completely unsupervised. Needless to say, they were impressed!
Because of their success using Zebrium to detect real application incidents induced by their open source Chaos Engine, we decided to build a Kubernetes demo environment that uses Litmus to create real incidents. This gives users a really easy way to test Zebrium without installing anything in their own infrastructure or having to wait days for a real incident to occur in their production environment.
Using a Chaos Engine to Generate Incidents on Kubernetes
Chaos Engineering is a concept made famous by Netflix with their Chaos Monkey which they use at scale to run chaos experiments to test the resiliency of their infrastructure and services.
The idea is the Chaos Monkey runs experiments such as randomly terminating nodes and containers to make sure a service is able to recover and stay up for users. Because they test potential failure modes constantly, they usually catch potentially major issues well ahead of real users being impacted, which is why most Netflix users rarely notice any issues with their service even if their underlying Cloud provider, AWS, has a major incident themselves. Because they’ve already tested and fixed potential reliability issues using their Chaos Engine they are able to handle them relatively easily!
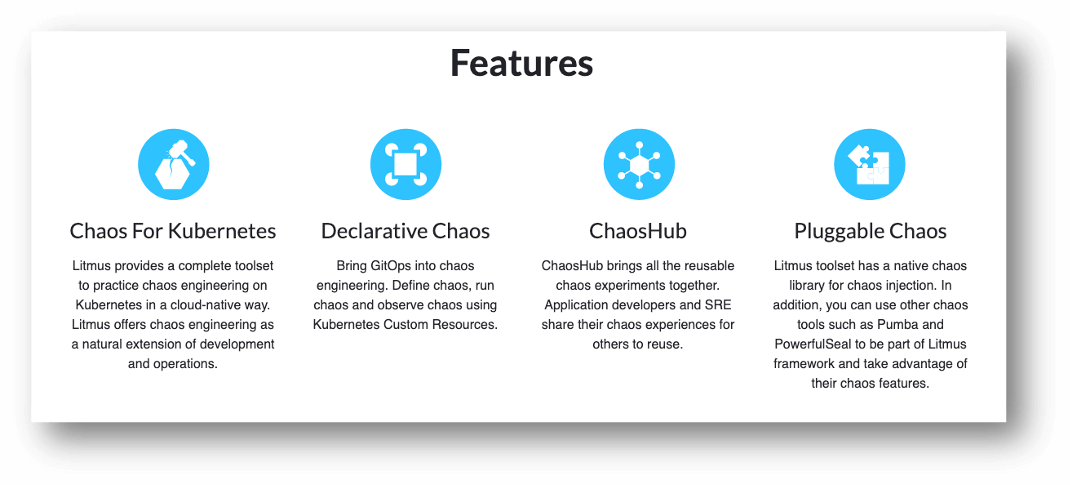
Litmus is one of several new tools designed to run Chaos experiments in a user’s Kubernetes cluster to allow them to also test and improve the reliability of their services. It’s open source, doesn’t require a separate server to coordinate experiments, and is fully scriptable so you can define experiments in YAML files to setup and run the experiments consistently between runs. It also has a Chaos Hub where the community can create and share experiments for different services that users can deploy and run easily.
This is great for our use case of providing a demo environment for new Zebrium users to generate test incidents, as we can completely script the deployment and running of the experiments making it really easy for new users to get started.
Running the Demo Environment
The entire demo environment can be spun up in 7 minutes in just one command using the manage.py Python script in our demo environment repo you can clone locally to run:
git clone https://github.com/zebrium/zebrium-kubernetes-demo.git
There are a few requirements to run the demo in the README.md file, but primarily you will need a Google Cloud account (we will add support for other Cloud providers later) and a free Zebrium account to get started. The script spins up and deploys a fully managed Kubernetes cluster on GKE, with all the required services deployed as below:
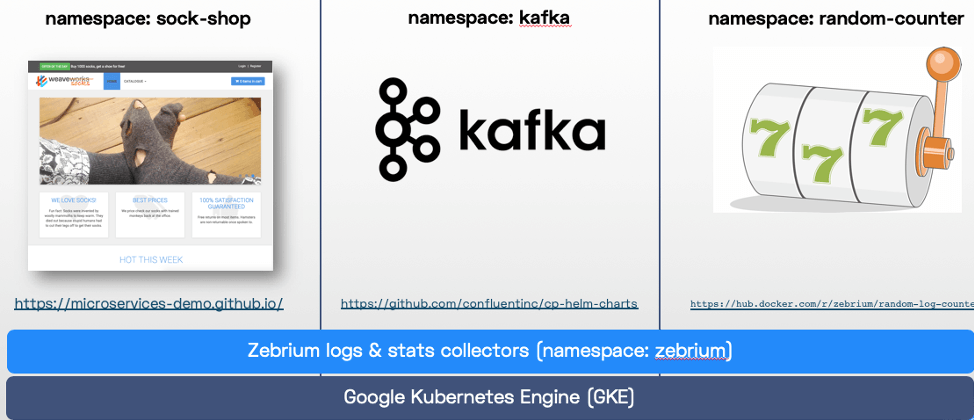
The Sock Shop application provides an eCommerce site built using microservices to run experiments against, and also has a user load generator running to simulate active users while the experiments run. We have also deployed Kafka on the cluster to run some Kafka experiments as Kafka tends to be particularly problematic when running on Kubernetes so can generate some nice Incidents for Zebrium to detect! Lastly there’s also a small Python script running that generates random log lines with a counter to show Zebrium’s automatic log parsing and graphing capabilities.
To spin up the demo you need to use the script’s start command:
./manage.py start --project {GC_PROJECT} --key {ZE_KEY}
There are currently 9 Chaos Experiments available to run, but more services and experiments will be added as available (waiting for Casandra next!). These run generic Kubernetes experiments against Sock Shop as well as some Kafka broker failure experiments against Kafka.
While you can run Chaos Experiments individually, once the cluster is fully deployed and stable (usually around 15 minutes after it’s been created), a user can just use a single test command to run all the experiments in order:
./manage.py test
In production environments, distinct actionable incidents don’t normally occur immediately one after the other, so experiments have an 11-minute wait between them to ensure Zebrium doesn’t group the incidents together. The entire test will take around 3.6 hours.
The Results
If you run the Litmus experiments in the demo Kubernetes environment end-to-end, Zebrium catches all 9 incidents with their correct root cause. For example when I ran it, the Pod Delete experiment below created the following incident in Zebrium: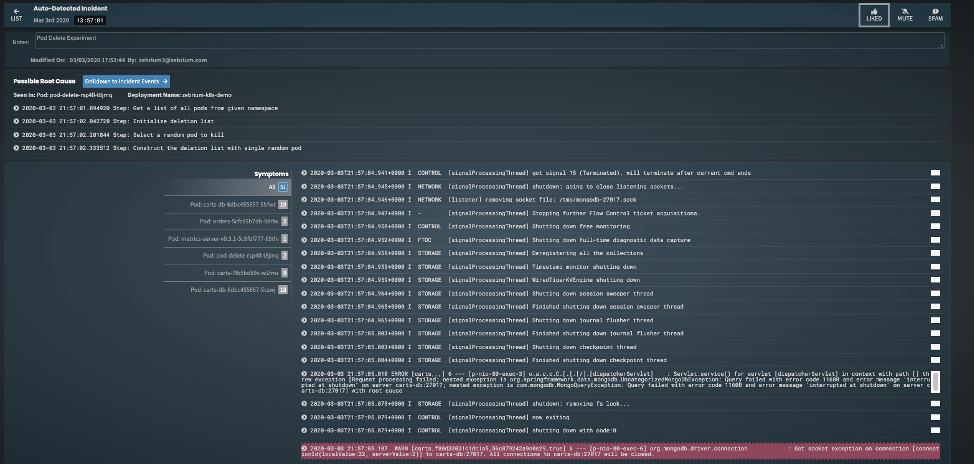
Although a little small to read, Zebrium found the actual root cause in the Chaos runner pod that was executing the Chaos Experiment (pod-delete-rsp4ll-t8jmq! In the incident, you can also see all the other services/pods that were impacted by the experiment, which includes the Cart-DB (which the experiment deleted) and the Carts service which relies on the Carts-DB to work, and highlighted in red, is a hallmark event which shows a MongoDB connection issue because the Carts service can’t connect to the Carts-DB pod anymore.
There was absolutely no pre-learning or pre-setup on the Zebrium side. All of this was detected automatically, completely unsupervised in a new Zebrium account with only 10M log lines that spanned 5hrs. The only thing Zebrium was the log streams from the Kubernetes cluster. From that, it figured out that an incident was happening, found its root cause and hallmark event and packed it all that up in a single incident.
Zebrium has also just released experimental support for collecting Prometheus metrics to improve the accuracy of its incident detection. This should be a game changer as it will look for anomalous metrics that are corelated to an incident found in the logs. Here’s an example on the incident view that was generated by the disk-fill experiment:
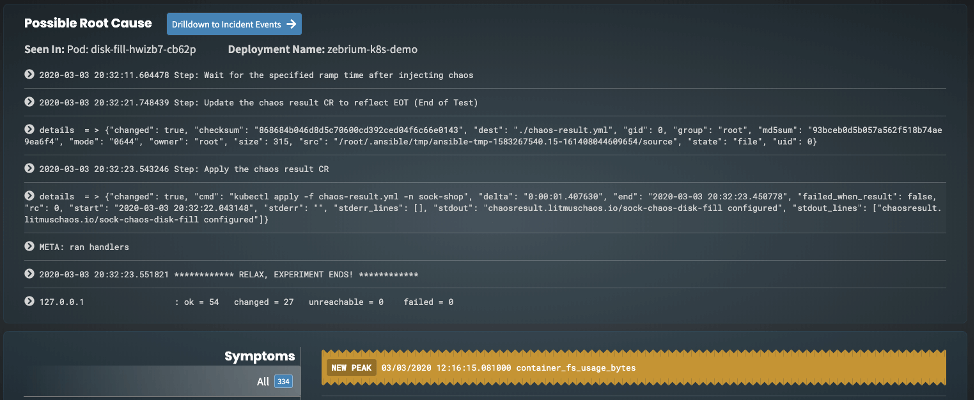
As you can see, Zebrium not only found the correct root cause of the incident (the disk-fill experiment runner pod) but also highlighted an anomalous metric it believes is related to the incident, in this case container_fs_usage_bytes. This makes sense as the experiment is essentially filling up the disk for the carts-db container to 120% of its disk quota, which will force the pod to restart, so you would expect this metric to spike up sharply and then stop as the pod was shutdown, which is exactly what Zebrium found:
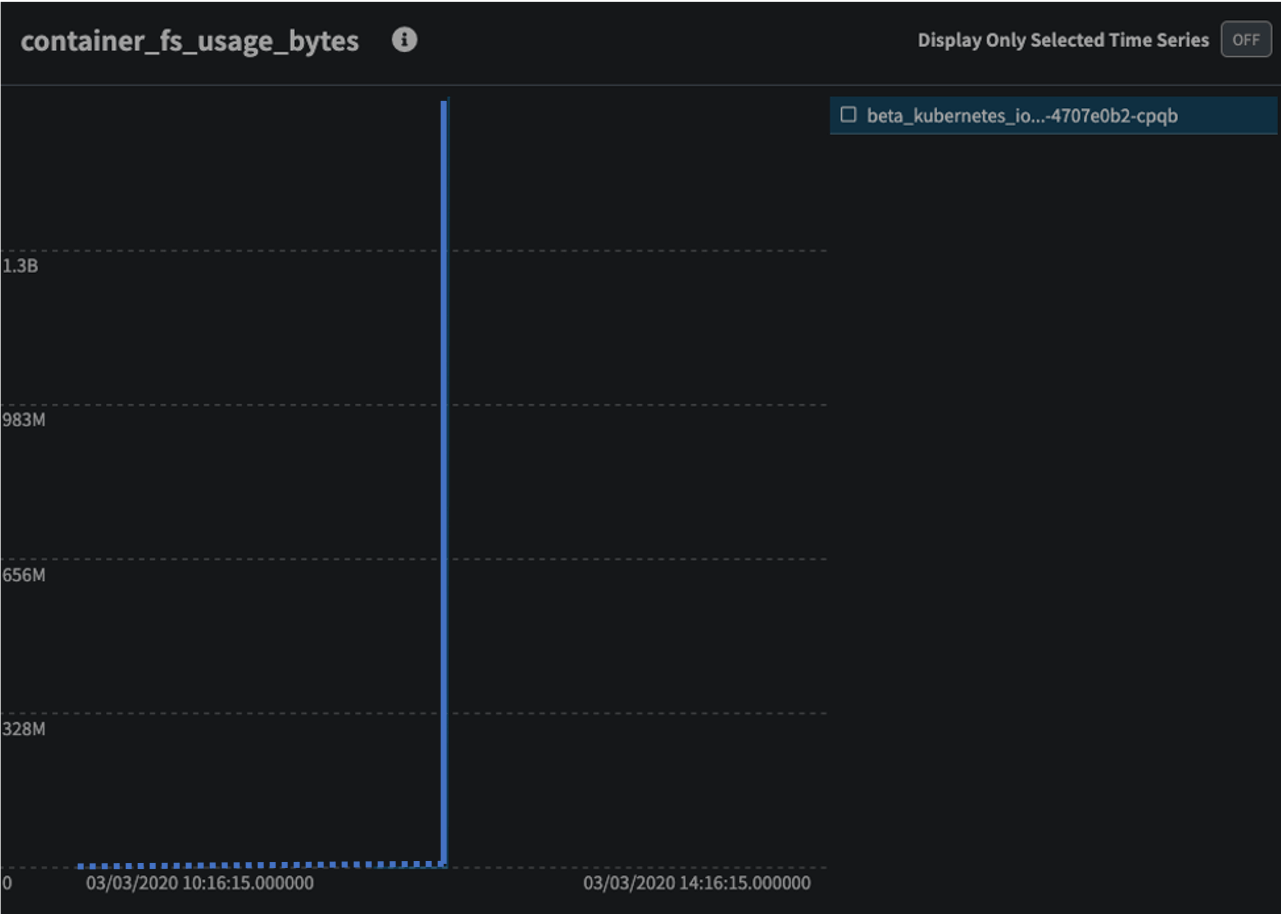
Again, this ran completely autonomously, on a new account with only 5hrs of data to learn patterns from.
Summary
As you can see, Zebrium is a very powerful tool for autonomous incident detection. When combined with a Chaos Engine like Litmus, it can autonomously detect the experiment-induced incidents, with the correct root cause. In practice, this would significantly reduce the Mean-Time-To-Resolution (MTTR) during an incident.
All the demo environment code is open source and you can run this demo yourself with a free Zebrium account. You can also watch a demonstration of this by signing-up for the on-demand webinar.
