

This project is a favorite of mine and so I wanted to share a glimpse of what we've been up to with OpenAI's amazing GPT-3 language model. Today I'll be sharing a couple of straightforward results. There are more advanced avenues we're exploring for our use of GPT-3, such as fine-tuning (custom pre-training for specific datasets); you'll hear none of that today, but if you're interested in this topic, follow this blog for updates.
You can also see some real-world results from our customer base here.
Our goal
I believe the future of monitoring has to include autonomous root cause tools. Deployment frequency and complexity make the "new" issue the driver of Mean-Time-To-Resolve (MTTR) today. You may always know when something breaks, but you won't always know what. Problem is, root cause often hides in log files... but since the volume of logs has grown enormous and it's not always clear what to search for when a new issue arises, we saw a need for a smarter tool to help with root cause.
Our approach in a nutshell
If you structure logs really well (we do this with machine learning), including free-text logs, even when there are only one or two examples for a given event type, you can start talking confidently about a "rare" event. Severity lets you talk about a "bad" event. So, you can imagine one log stream expressing a "rare" event, and then another log stream expressing an event that is both "rare" and "bad". A simple point process model lets us talk naively about how likely it is that such a pair of events should show up as close together in time or closer, given patterns of "rare" and "rare"+"bad" events in those two streams. Watching the data for a while will let you estimate parameters for this model, and you can start picking out bouts of such event pairs. Zebrium takes such a bout, and generates an incident report from it. The results we are seeing…
The plain language challenge
Our approach works really well at generating root cause reports: if there's a root cause indicator in the logs, it will almost always make its way into a concise root cause report. Our approach has proven robust to different kinds of applications and logs; it requires no training or rules, pre-built or otherwise.
However, there's a big challenge remaining here. The last mile of delivering the benefits of autonomous Root Cause Analysis (RCA) is translating even the concise reports we generate into something the user can understand. The user who needs the quick RCA is not always the person who can understand the oblique root cause indicators in a technical log file. Who is to consume these reports, and what composes them?
This challenge is even more stark for an Managed Service Provider (MSP) or enterprise. At a small company, engineers may be responsible for front-line triage. At a large company or MSP, there will be a front-line, typically junior person who needs a quick RCA; they can't be expected to know all the different intricacies of application logs and what those logs mean. To bring value over the last mile to them, we need plain-language.
Enter GPT-3
Now that I've set the stage, let me show you a couple of examples that I think make it clear how transformational GPT-3 can be in the context of our problem. I think you'll agree with me that autonomous RCA seems a lot more real when it's translated into plain-language, and surely a lot more accessible by a lot of users.
GPT-3 is a state-of-the-art bidirectional autoregressive transformer model, with parameters in the hundreds of billions. It is produced, trained, and maintained by OpenAI, and it has really brought start-of-the art, deep NLP to developers’ fingertips.
The most basic procedure for using GPT-3 looks like this -
1) Construct a “prompt” for the model – this is a sort of open-ended document that leaves the model to “continue the story”, as it were; the continuation or response is called a “completion”. For the below two-line examples, I used the following simple prompt construction:
An expert examined the logs for the incident.
The first log message was: <first_line_goes_here>
The last log message was: <second_line_goes_here>
The expert described what had happened, in plain English:
2) Select model (I used davinci) and parameters - for the below examples, I used the following parameters to the davinci GPT-3 model:
{
"max_tokens": 128,
"temperature": 1,
"top_p": 0.05,
"presence_penalty": 0.3,
"frequency_penalty": 0.3,
"best_of": 10
}
3) Call the API; post-process completion for dangling or repeated phrases, to-taste. Serve warm.
Example one: Database shutdown
We shut down the Postgres database backing our Atlassian stack. Thousands of events, largely errors, ensued in the logs. Zebrium dutifully generates a root cause report, based on an ML-driven auto-detection. The report looks like this:
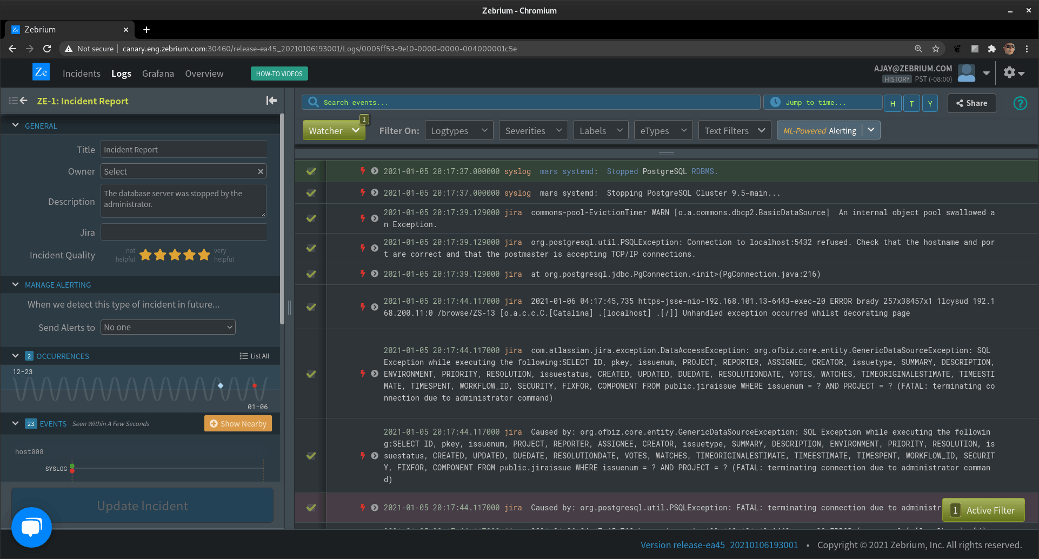
As you can see, Zebrium pulled about a dozen log events into the report; the first 9 are shown in the image. You’ll notice that the first event is colored green and the last event purple; these are the “FIRST” and the “WORST”, and we use these to characterize the incident in the incidents list. Here’s what that looks like:
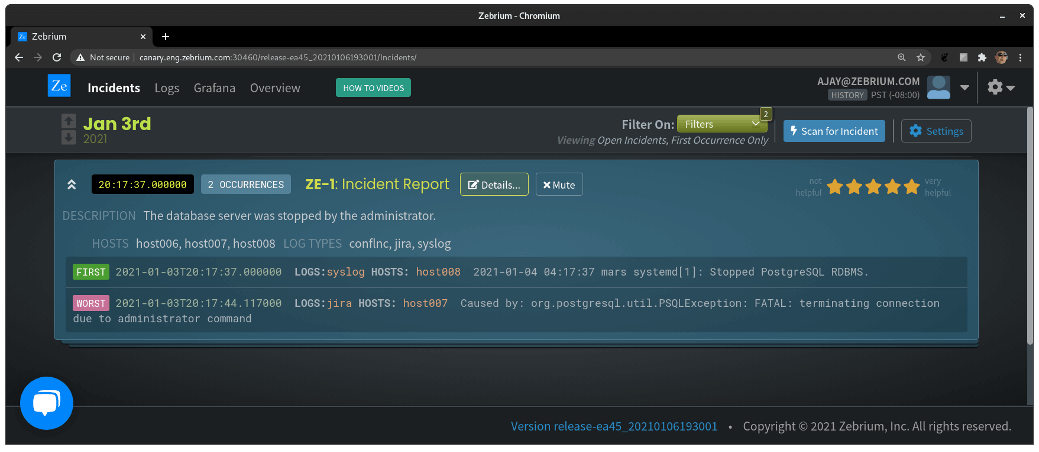
OK, so Zebrium did a pretty good job here. It autonomously picked these two log events out of thousands to display to the user on the list page. Often, the “FIRST” event reflects root cause and the “WORST” reflects follow-on problems; you’ll note here that the first is not even an error, but it’s rare, and happens too close to other incident events, according to our model, to be a coincidence.
Now in this case, it’s pretty clear to someone who has looked at a log file before that the database was shut down by the administrator. You’ll also notice, though, above the log events, a field called “DESCRIPTION”: this was generated by GPT-3. It says:
“The database server was stopped by the administrator.”
Why this summary is also amazing
We passed in the “FIRST” and “WORST” events, as described above, to GPT-3. Notice that the first line says that the “PostgreSQL RDBMS” was “Stopped”. The second line says that there was a “PSQLException” indicating that a connection was “terminating due to administrator command”.
The word “administrator” appears on a different line than the word “PostgreSQL”, and nowhere in the log messages are the words “database” or “server” to be found at all.
The algorithm is doing the following:
1.) Inferring that the statements on the two lines are related
2.) Inferring that they are both speaking about a “database server”
3.) Putting the two statements together: “stopped by the administrator”
Essentially, this is the sort of summary someone would put into a ticketing system; here, it’s being done automatically, thanks to an appropriately selected pair of log messages coupled with a language model.
Example two: Out of memory
In this case, and using the same parameters as were used in the previous example, we take a root cause report for what turns out to be an out-of-memory issue to GPT-3 and see what sort of summary it gives us.
This particular report was generated in response to a signal from a monitoring tool that saw endpoint latencies spike too high. The system was configured with Zebrium to provide root cause observability across the stack. Here is the report Zebrium ML generated:
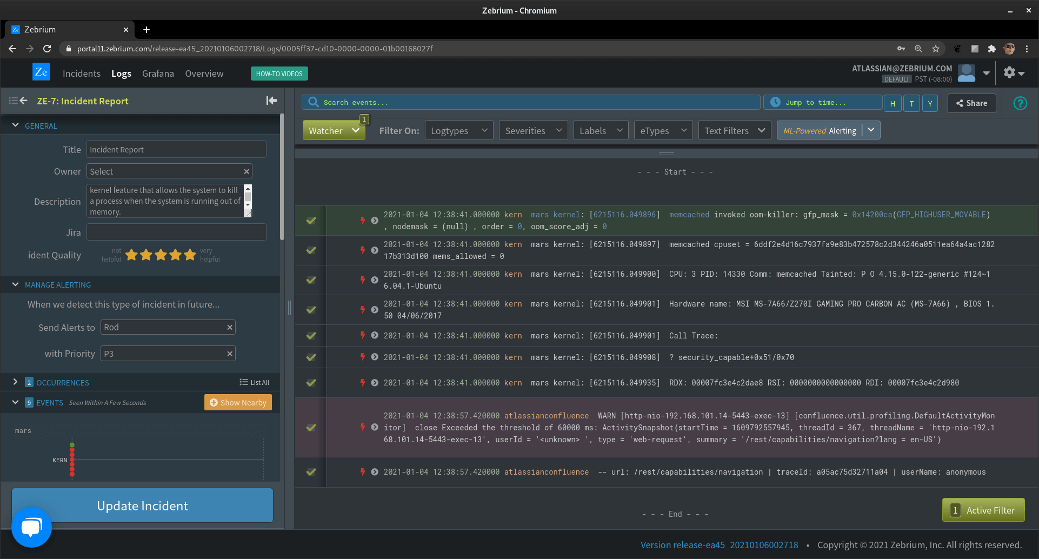
As you can see, Zebrium pulled about a dozen log events into the report; the first 9 are shown in the image. You’ll notice that the first event is colored green and the last event purple; these are the “FIRST” and the “WORST”, and we use these to characterize the incident in the incidents list. Here’s what that looks like:
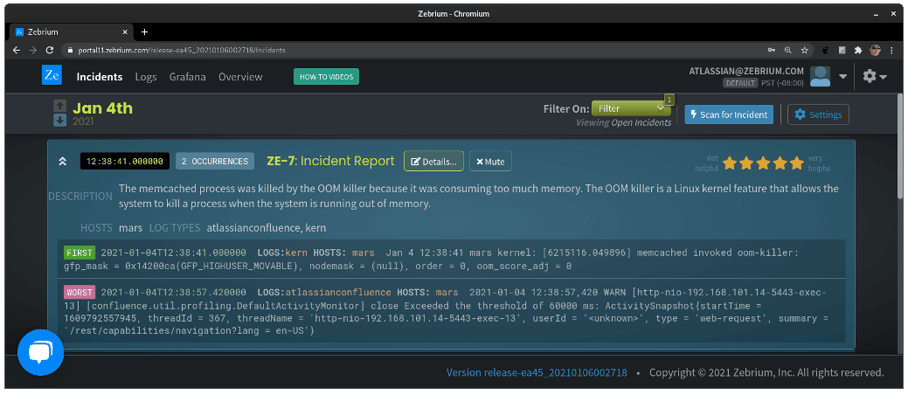
In this case, it’s not so clear that the problem is due to an out-of-memory issue, unless the reader is familiar with Linux and the OOM killer facility. There are a lot of technical parameters in these events as well, obscuring what was really at the heart of the problem.
Taking a look above the log messages again, in the “DESCRIPTION” field, let’s see what GPT-3 gave us:
“The memcached process was killed by the OOM killer
because it was consuming too much memory. The OOM killer
is a Linux kernel feature that allows the system to kill
a process when the system is running out of memory.”
Why this summary is also amazing
What this summary tells us explicitly in plain-language is that the system was running out of memory. This is in fact the root cause of the original incident, tallying up a successful root cause summary.
For an L1 or L2, the Zebrium root cause summary may not be enough. That person won’t necessarily know that OOM means out-of-memory, or that the “FIRST” message isn’t talking about an application issue entirely within memcached.
What more I wanted here
In the second example, I would have liked to have seen some recognition that the first line implies that the system was out-of-memory, and therefore the second line was due to related problems (in fact, the application server was paged out). It’s a lot to ask, but I think it might be possible, given some combination of more expressive prompts, fine-tuning, and presenting GPT-3 with other select data from the report (in this case, the report also included metrics anomalies showing a plunge in swap free).
A cool direction
You may have noticed that GPT-3 gave us a lot of extra detail about the Linux OOM killer than was mentioned in the log messages themselves. I believe it was able to provide this context in the same way it knew that PSQL referred to a database server: it was trained on the internet. There is likely enough information in the public domain that, as GPT-3 was being trained, it picked up enough cursory knowledge of these sorts of systems to add additional value.
To test my hypothesis, I spent some time fiddling quite unscientifically with the prompt and model parameters, trying to get it to expound on the OOM example as describe above. I also gave the model a much larger budget of response tokens. Eventually, I teased out this response:
The root cause of the problem is that oomkiller was invoked because of a large number of allocations. The kernel's OOM killer is triggered when the system is out of memory and needs to free some memory. Since this action can kill processes, it is protected by a flag (oom_adj) which can be set or cleared by user space applications. When this flag is set, the kernel will kill processes for which there are no more than one page left in their memory cgroups (cgroups are used to control resource usage on a per-process basis).
By default, Linux uses an algorithm called "RSS" (Resident Set Size) to decide whether or not to trigger the OOM killer. This algorithm calculates how much physical memory each process has reserved and compares it with its current virtual size. If there's enough memory available, then RSS will not touch any process even if they have been consuming too many resources for too long; but if there isn't enough memory available, then RSS will trigger the OOM killer and start killing processes until there's enough physical space again.
So, there’s obviously a lot of specialized knowledge locked away in the trained model, just waiting to be unlocked by the right inputs. Really awesome.
Conclusion
GPT-3 has a lot more capability than we’ve tapped into yet. Even so, I hope I’ve convinced you that the autonomous future of monitoring is already upon us. If you would like to participate in the beta program for the GPT-3 feature, please email us (our production Autonomous RCA platform does not yet include the GPT-3 feature). Follow this blog for my next articles on our use of GPT-3, where I promise to go into more technical depth.
