We all know the drill. Sun, warm water, tranquility, silence, zzzz... Then your phone blares and buzzes, violently waking you from sleep. It’s dark and you quickly leave the dream behind. With blurry eyes you read, “AppDynamics Alert: latency threshold exceeded on page: shopping_cart_checkout”. Damn, that’s the
service that was upgraded this afternoon.

Coffee in hand, Opsgenie guides you to your APM tool. You click your way through some dashboards. All was fine until 11 minutes ago. Now the shopping cart service is down. No revenue is coming in. You restart the shopping cart service and the pending transactions start going through. And then your phone buzzes again and the dashboards turn red. Time to revert to yesterday’s version of the service. But that doesn’t work either.
You reluctantly open up your logging tool and start searching. There are thousands and thousands of errors and warnings across the different logs. But they seem mostly normal and harmless. You wish the logs weren’t so noisy. And you know you’re not going back to sleep anytime soon!
Automated root cause analysis right inside Opsgenie
Now imagine this: After being woken up, you open Opsgenie and see this:
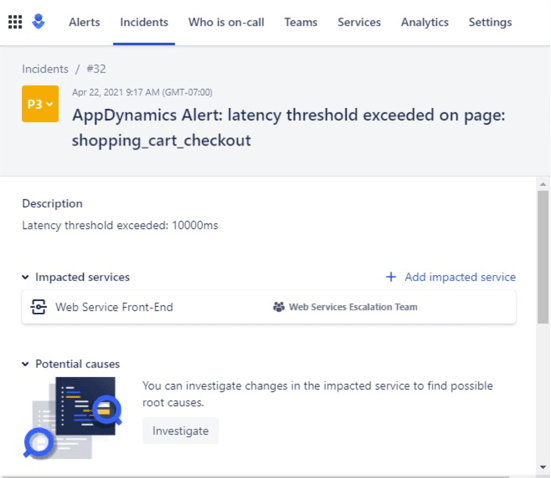
And then you click the Timeline and see this:
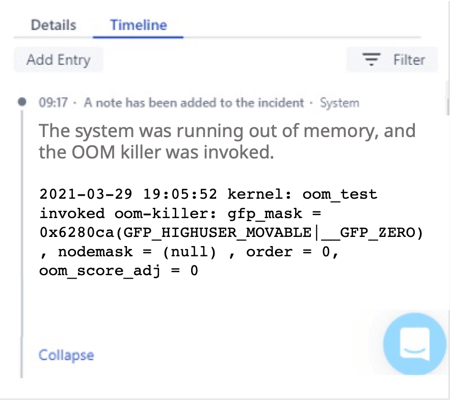
Bingo! The root case. One of the developers must have accidentally left oomtest running on your production node! It’s that little tool that randomly wakes up and attempts to consume all available memory on a node.
How did the root cause “magically” appear in Opsgenie?
Quick background. Zebrium uses unsupervised machine learning to automatically find incident root cause by looking for hotspots of correlated anomalous patterns in logs and metrics (you can read all about it here). Zebrium can perform its own detection, but it can also take a “signal” from an external application and use that as a trigger to generate a root cause report.
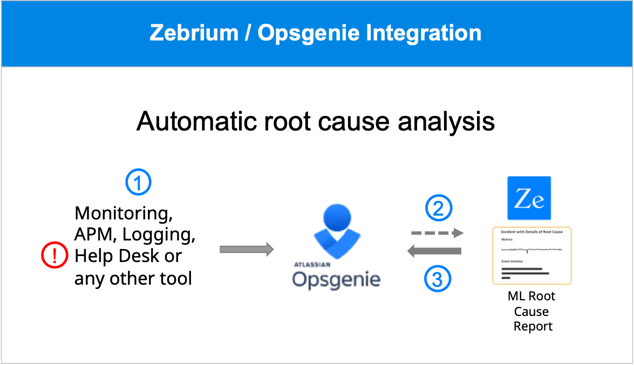
With the Zebrium / Opsgenie integration, the signal to provide a root cause report comes from Opsgenie. The process looks like this. Refer to the picture above:
- An APM (or other) tool detects a problem (in this case, a threshold has been exceeded) and opens an Opsgenie incident. The pager goes off and the on-call SRE is woken up.
- Opsgenie automatically sends a signal to Zebrium requesting a root cause report.
- Zebrium responds with a summary of the root cause report and adds it to the already opened incident.
- On-call SRE now understands what happened, fixes the issue and goes back to sleep!
The Configuration between Zebrium and Opsgenie is easy! Full details can be found here, but below is a quick summary:
In Opsgenie, from Settings/API Key management, add a new API key and enable it for read, create and update access. Now in the Zebrium UI, set up an Inbound Alert for Opsgenie, and enter the API key you created and the Opsgenie region. This will create an inbound webhook URL that Opsgenie can use.
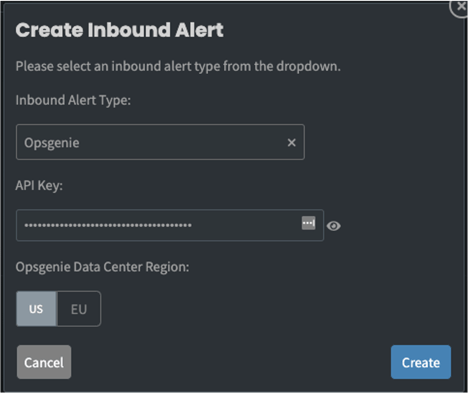
Next, go to the Opsgenie Integration page and click the Zebrium integration and follow the instructions you see on the screen. You will need to use the webhook URL that was just created.
Once the configuration has been completed, new incidents will trigger a signal to Zebrium, and a root cause summary will show up in the incident. No more hunting for root cause!
You can also use Zebrium and Opsgenie for proactive detection of new/unknown issues
Zebrium constantly scans and automatically creates RCA reports for abnormally correlated anomalies across logs and metrics. By setting up an outgoing alert from Zebrium to Opsgenie, you can trigger the creation of Opsgenie incidents.
Since most environments already have monitoring tools that create incidents for major outages, we recommend configuring Zebrium ML-detected incidents as priority P3. Zebrium is not rules-based, so this can be a very effective way of catching new, rare or unknown issues early. Engineers can use them to improve product quality and proactively fix latent bugs, before they manifest as production P1 incidents. We use this feature extensively at Zebrium and have so far avoided several major problems in this way!
Full details on how to configure Zebrium and Opsgenie for proactive incident creation can be found here.
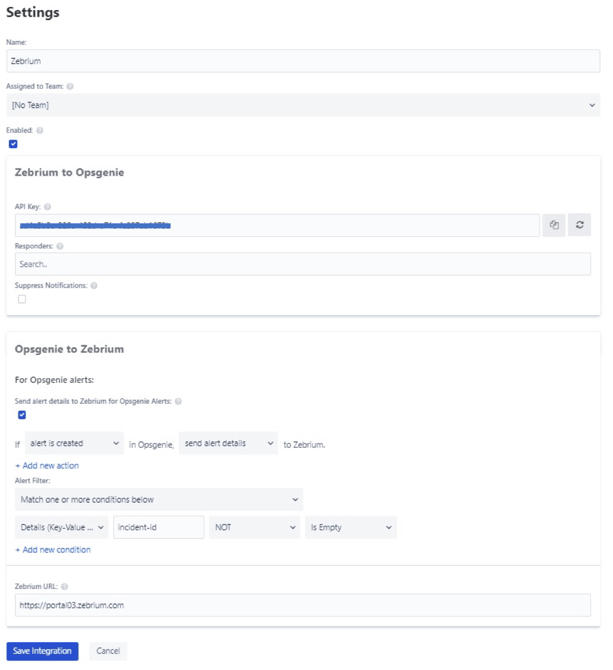
The picture above shows the Opsgenie configuration for two way integration with Zebrium:
- Zebrium to Opsgenie - when Zebrium creates a proactive incident, it will create an incident in Opsgenie (recommend creating them as P3 incidents).
- Opsgenie to Zebrium – when a new incident is created by any tool in Opsgenie, it will be automatically augmented with a root cause report created by Zebrium’s ML.
Summary
Most environments already have mechanisms to detect major incidents. Using Opsgenie, the incident response process is made as painless as possible. But at some point, if details of the problem are not immediately obvious, SREs and developers will inevitably spend hours hunting through dashboards and logs to find root cause.
This need not be the case! By integrating Zebrium and Opsgenie, details of root cause will automatically appear right inside the Opsgenie incident. So when you’re next woken up in the middle of the night by your pager, you need not be worried, you’ll have the problem sorted out and be back asleep in record time!


