
Based on our experience with hundreds of incidents across nearly a hundred unique application stacks, we have developed deep insights into the specific ways modern software breaks. This led us to thoughtfully design a multi-layer machine learning stack that can reliably detect these patterns, and identify the collection of events that describes each incident. In simple terms, here is what we have learned about real-world incidents when software breaks. You can also try it yourself by signing up for a free account.
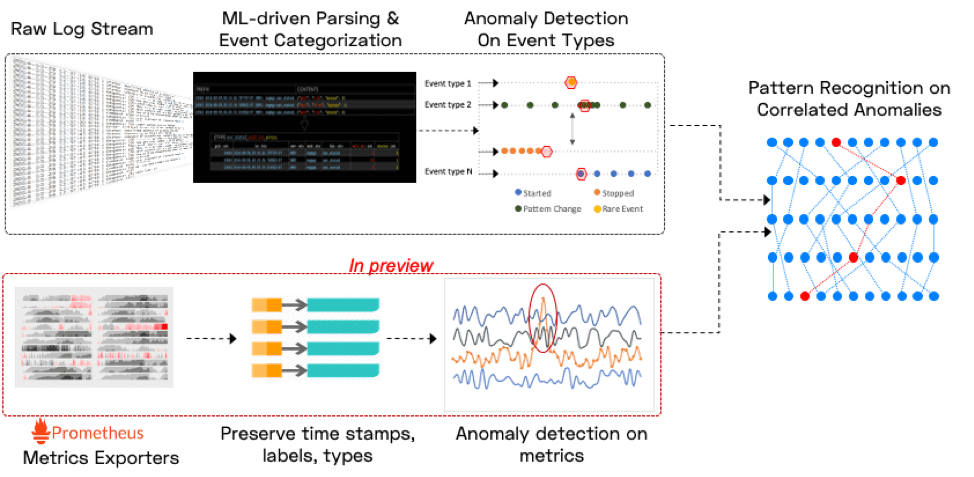
When software breaks, unusual code paths are exercised and rare states are encountered. Since logs correlate very closely to the execution of specific code paths or error conditions, the above observation translates to log patterns: when software breaks, unusual log patterns are observed, for example significant changes in event frequency, periodicity, severity or values of embedded metrics. Two important examples of the above are the occurrence of first time or rare events, and the “disappearance” of normally seen events.
A second big insight into software failures is that real world software incidents don’t just result in one anomaly – they result in an unusually tightly clustered sets of anomalies. An aside on metrics: metrics anomalies provide a valuable layer of insight on top of this foundation – illuminating which externally visible symptoms relate to the current problem. But we’ve found it much harder to start incident detection with metrics anomalies and achieve high signal to noise. As a result, we do generate anomalies on Prometheus metrics and correlate them with log anomalies, but do not consider them a clear enough primary signal to base incidents on.
Doing this well is hard stuff (gory details here), particularly because we want it all to work without configuration, tuning or training. Our goal is to connect to a new application within 5 minutes, and start reliably detecting software incidents within the first hour – all without any switches (and absolutely no pre-built rules or knowledge of the app).
As a user, here is what you need to know about incidents detected by us:
- An incident is a collection of log events and metrics that are both anomalous, and clustered together in a way that is highly unlikely to have occurred by coincidence.
- The anomaly (or group of anomalies from a single service) that happens first chronologically is considered the likely root cause, and the trailing ones (often from different services) make up the symptoms.
- To summarize the incident alert, the ML picks out the event that the user will likely care the most about – because it is a severe error, or has been known to correlate with severe errors in the past. We call this the “hallmark event”, and it is not necessarily the first root cause event.
Customizing Incident Feeds and Alerts
Although our goal is to minimize the work our users have to do to get value, we do offer ways to quickly and effectively customize our ML for your needs. These include:
- A switch to “mute” infrastructure alerts (e.g. Kubernetes incidents that don’t affect your application, or incidents related to various agents attached to your application). Muted incidents are still visible in our software, but do not generate alerts.
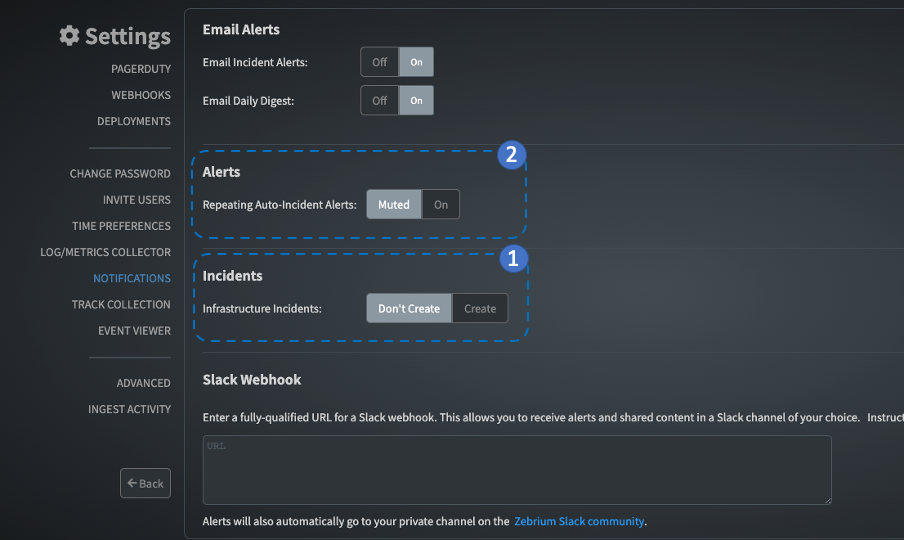
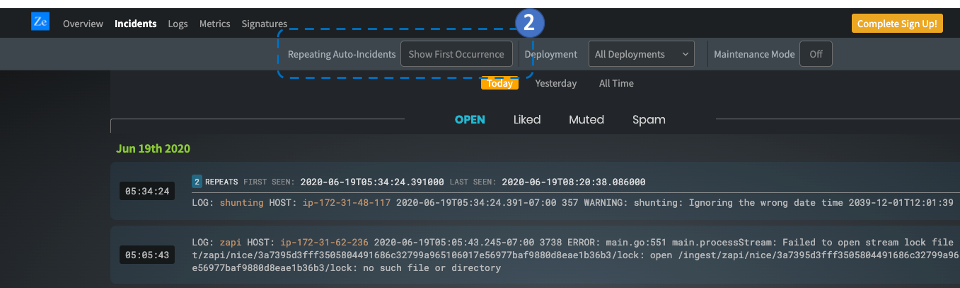
- When an incident occurs repeatedly, the responsible team may not want to get alerts for each occurrence (and instead only know the repeat count). In this case we offer a switch to only alert on first occurrence, which is on by default (Repeating Auto-Incidents under Settings|Notifications). You can always view repeating occurrences on the incidents page using the button below.
- The ability to mute a specific type of incident. Most software environments have issues that are known and tolerable – future occurrences of these incidents can be muted simply by clicking the “mute” button on an incident (in the details view).
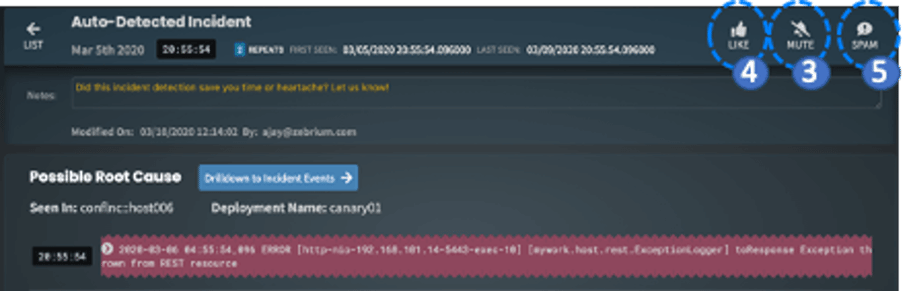
- Of course, while not required, we encourage you to click the “LIKE” button and add notes when we catch real issues. This not only gives us feedback, but also keeps your incident “inbox” clear.
- And in the rare cases we catch an incident you consider totally invalid – let us know by clicking the “SPAM” button on it.
- Advanced Setting: Most users will find that a good balance between incident quality/severity, and frequency is achieved within a few hours. If however you have a very dynamic environment with lots of changes and errors, you have the option of dialling down incident sensitivity under the Advanced Settings tab. This is set to high sensitivity by default - changing it to medium or low sensitivity will lead to fewer incidents being generated, with a higher bar for the severity and count of anomalies and errors.
- Expert only setting: Finally, our application is built for operating environments (staging or production), but there are times you might be stressing your software more severely and quickly (for example running a series of rapid Chaos Experiments). To handle this we allow the user an Advanced Setting to set a shorter Refractory Period (google definition: a period immediately following stimulation during which a nerve or muscle is unresponsive to further stimulation.) Warning: this is a very sensitive setting and should only be used for fine grained testing.
If you haven’t already, please try this for yourself by signing-up for a free account. We welcome your feedback!
