
Datadog is one of the most popular observability platforms today, and offers a rich set of capabilities including monitoring, tracing, log management, as well as machine learning (ML) features that help detect outliers. One of its most interesting feature sets falls under the Watchdog umbrella.
Watchdog Root Cause Analysis
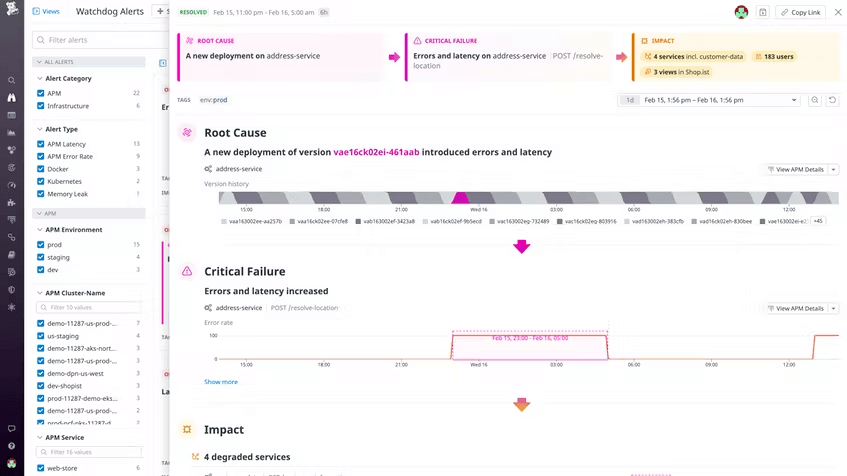
Watchdog automatically detects outliers in metrics or traces, so if your application is properly instrumented and you encounter one of the known problems, then it can quickly show you the root cause. Today the set of failures that can be auto-identified cover the following:
- Bad code deployment
- Increase in traffic from a client
- AWS instance failure
- Disk reaching max capacity
Datadog is working to add support for more failure modes in future updates, including CPU saturation and memory leaks.
While this capability is promising, there are some limitations. The first is that every part of your application stack will likely not be instrumented to collect all the right events and traces. The bigger limitation is that any cloud native application will encounter many new and unique problems on a regular basis, particularly software bugs. Most modern applications are composed of dozens of microservices, and experience changes (new versions) on a daily basis.
As a result, there will be a never-ending set of new failure modes. An approach that relies on matching fingerprints covering a small set of known failures will not keep up or help you troubleshoot the majority of new incidents. Our team has accumulated decades of experience building industry leading rules-based monitoring solutions (that identify root cause, not just symptoms), and know first-hand that the burden of building and maintaining rules to identify root cause is becoming increasingly impractical as applications become more complex and the rate of new updates grows faster.
The Next Step: Watchdog Log Anomaly Detection
Perhaps recognizing this limitation, Datadog recently introduced a new capability called Watchdog Insights Log Anomaly Detection, which applies log anomaly detection to automatically identify events of interest. Specifically, it tries to surface events or sources which account for an unusually high percentage of errors, to help an engineer troubleshoot a problem faster. This can work in two ways:
- If a particular host or agent suddenly shows a spike in access log errors, then this feature would highlight that host or agent to guide the troubleshooter in the right direction. This can be very useful when analyzing access logs.
- Watchdog Insights also tries to identify event types (log patterns) that are responsible for an unusually high number of warnings or errors. Again, this is handy to narrow down troubleshooting when a particular event pattern spikes in volume.
Watchdog Log Anomaly detection appears to be an intuitive feature, and feels like a natural extension to DataDog’s strong monitoring capabilities. Particularly when dealing with web-apps, it can quickly help you narrow down which endpoints, hosts (or other fields) are outliers in generating disproportionate errors and speed-up resolution of these problems.
The Ultimate Evolution – What Automated RCA Should Look Like
While useful in certain scenarios, Watchdog Root Cause Analysis and Watchdog Log anomaly detection don’t quite get you to the ultimate nirvana – automated root cause analysis for any type of problem. Here are some key attributes of the ideal solution that are not covered:
- Ability to root cause any type of failure scenario:
-
- As pointed out above, Watchdog RCA currently handles a small set of known failure modes. Although this list will grow, root cause based on pre-defined fingerprints will never catch failure modes unique to each software environment, particularly in a cloud native world where software changes fast and failure modes multiply each week.
- Watchdog Log Anomaly Detection goes further by not relying on a finite set of pre-built rules, but it still only catches a narrow set of sources or events – typically ones where the error rate of specific events is significantly higher over a period of time vs other events or sources. This is useful for catching a bad endpoint or host using access logs. But this approach can miss a far wider set of failure modes where a rare info level event is the actual root cause indicator – rather than an error that is suddenly spiking in volume. We observed this in a couple of simple failure scenarios using an open source K8s based application (Sock Shop). In one case we broke the app by inducing a network corruption using the CNCF Litmus chaos In a second other case, we forced memory saturation which lead to some services crashing. Watchdog Log Anomaly Detection was unable to identify the correct root cause indicators from the logs in the above tests (it either identified nothing , or identified events that were unrelated to the actual problem). See “Test Results” below for more detail.
- Accuracy
-
- An automated root cause analysis feature should be accurate enough that an SRE can rely on it under pressure. It should generate a precise and concise result (i.e. highlight the specific events that explain root cause), rather than a potentially large list of event patterns that requires human analysis to interpret. Ideally you would want this to be validated across a wide range of software stacks using a large number of real-world production incidents.
- Ability to correlate root cause indicators and symptoms across services automatically
- During incident response, the end goal of the troubleshooting exercise is to reconstruct the full sequence of events that identify root cause indicators and how they relate to the symptoms.
- This means correlating unusual/rare events and errors across services to describe the full narrative of cause and effect. Broadly speaking, Anomaly Detection features (including Watchdog’s Log Anomaly Detection) do not claim to or attempt to correlate these kinds of event pattern found in the logs (nor for that matter does any other log anomaly detection feature from any vendor in the market).
- Summarize problems using natural language
-
- Often, the SRE or DevOps Engineer who first notices a problem may not know enough about the software stack to assess the importance of the visible symptoms, or to triage and route the problem to the appropriate developer team.
- Ideally, automated RCA should also provide an intuitive summary to help the frontline engineer with both challenges. This could be in the form of an easy to understand sentence or it could involve highlighting important words that a human would easily recognize and understand.
- Like most other log anomaly detection implementations, Watchdog Log Anomaly Detection shows example patterns of events with anomalous counts. There is no kind of “human readable” summarization.
Zebrium Root Cause as a Service is a Natural Evolution from Log Anomaly Detection
Zebrium has spent many years studying hundreds of production incidents in order to understand and characterize how humans find root cause indicators in logs (details can be seen in this video). Our Root Cause as a Service (RCaaS) platform is modeled on these learnings.
RCaaS automatically finds the best possible root cause indicators in the logs for any kind of software or infrastructure problem. In simple terms, it finds the same log lines a human would have eventually found by manually digging through the logs, but it does this in-real time and at any scale. The results are delivered as a root cause report containing an English language summary (leveraging the GPT-3 language model), a Word Cloud that brings attention to important words in the log lines, and a small sequence of log lines (typically 10-60) that highlight the root cause and symptoms. RCaaS does not require pre-built rules or manual training.
A recent third-party study using 192 actual customer incidents from four product lines showed that Zebrium automatically found the correct root cause indicators in over 95% of incidents. Full details of this study can be found here: https://www.zebrium.com/cisco-validation.
The best part about RCaaS is that it works natively with Datadog and complements the entire Datadog feature set. Through either a native Datadog app widget or an events and metrics integration (see here), when a problem occurs, you will automatically see details of the root cause show up on any Datadog dashboard.

Test Results: Zebrium RCaaS vs Datadog Watchdog Log Anomaly Detection
As mentioned above, we tested two failure scenarios using an open source microservices online shopping application (Sock Shop), and the CNCF open source Chaos tool called Litmus. We let both Datadog and RCaaS receive logs from the application for several hours before running the tests to break the application environment. Aside from this short “warm-up” period, this was a greenfield test - neither Zebrium’s RCaaS, nor Datadog’s Watchdog Log Anomaly Detection were customized or trained in ANY way whatsoever about this application, the chaos tool, or the specific failures introduced.
Test 1: Network Corruption using Litmus Chaos Engine
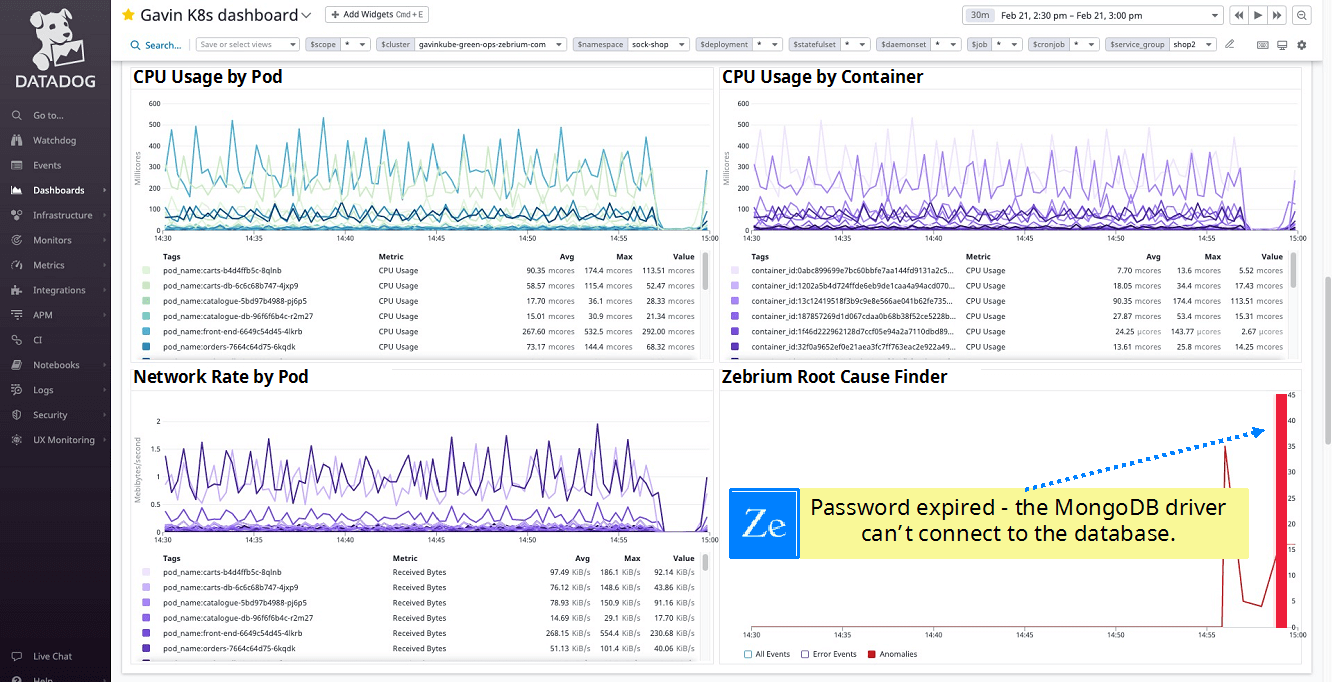
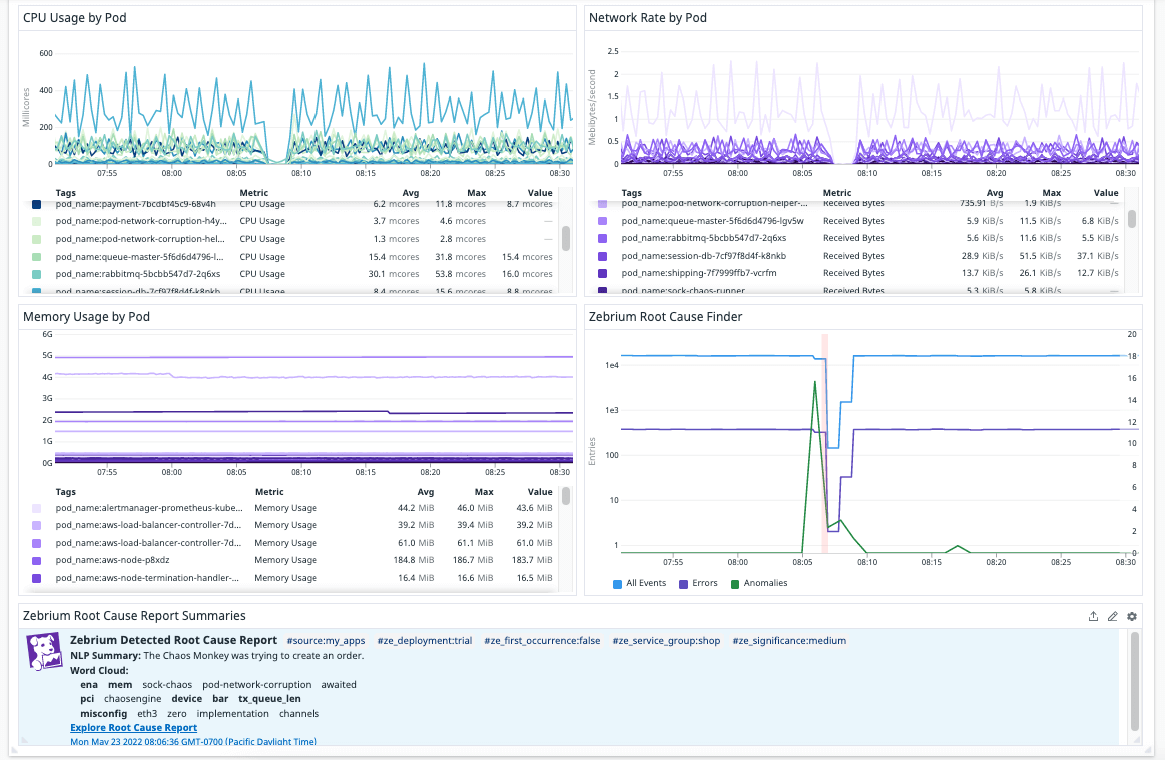
As soon as the Litmus Chaos Engine introduced network corruption in the Kubernetes environment, Datadog’s K8s dashboard showed the symptoms. And, just below on the same dashboard (using Zebrium’s integration with Datadog), the Zebrium RCaaS panel immediately showed a report that lined up perfectly with the drops in CPU and Network traffic. The report highlighted the correct root cause indicators and the natural language summary provided a strong clue as to the root cause. Note keywords such as “pod-network-corruption”, “misconfig” and “tx_queue_len” – all related to the failure mode.
By clicking the link on the Datadog dashboard, the full RCaaS report can be seen in the Zebrium UI. The report concisely shows the chaosengine starting the network corruption test and then a kernel message indicating a misconfig on eth0. This is followed by the symptoms (error in the orders and frontend services).
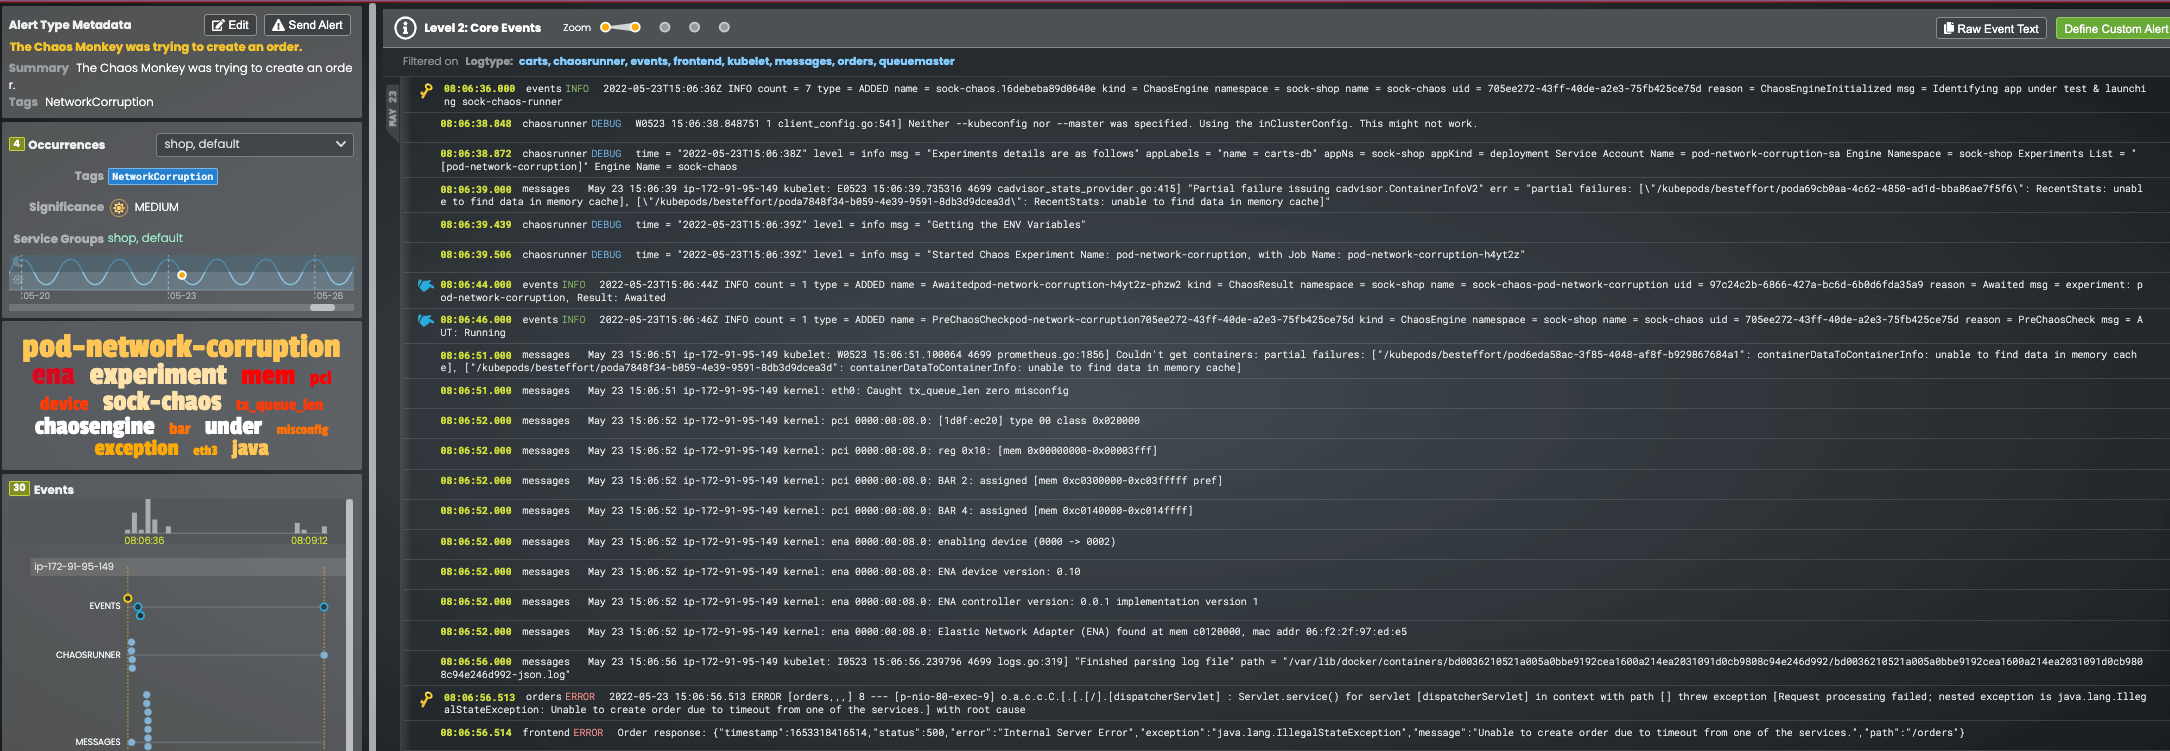
You can watch a 2-minute video of this here.
By comparison, Datadog’s Log Anomaly Detection picked out one event pattern in that time period – which turned out to be unrelated to the root cause or symptoms of the problem.
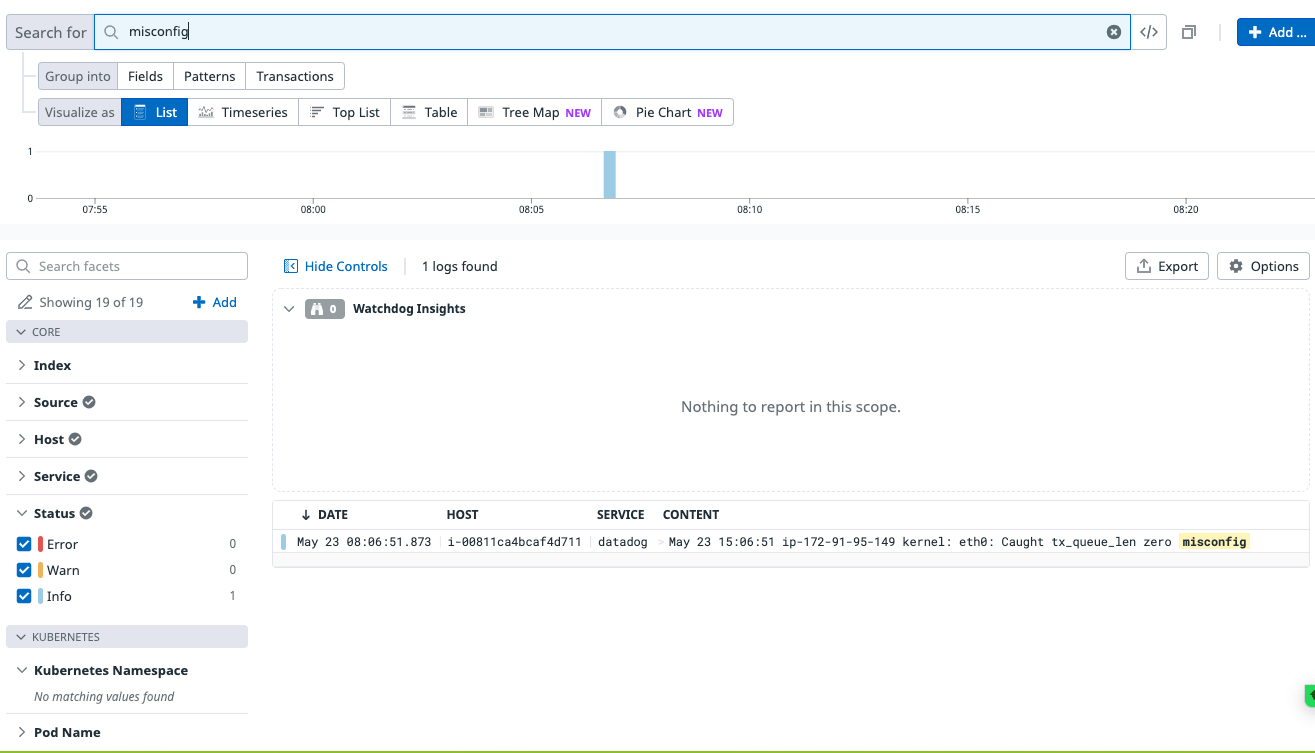
 Just to make sure this failure wasn’t due to incorrect setup, we searched for the key events that Zebrium found using Datadog’s log manager, and sure enough they were received. But the anomaly detection feature failed in identifying them as key and useful events for root cause analysis.
Test 2: Memory Starvation
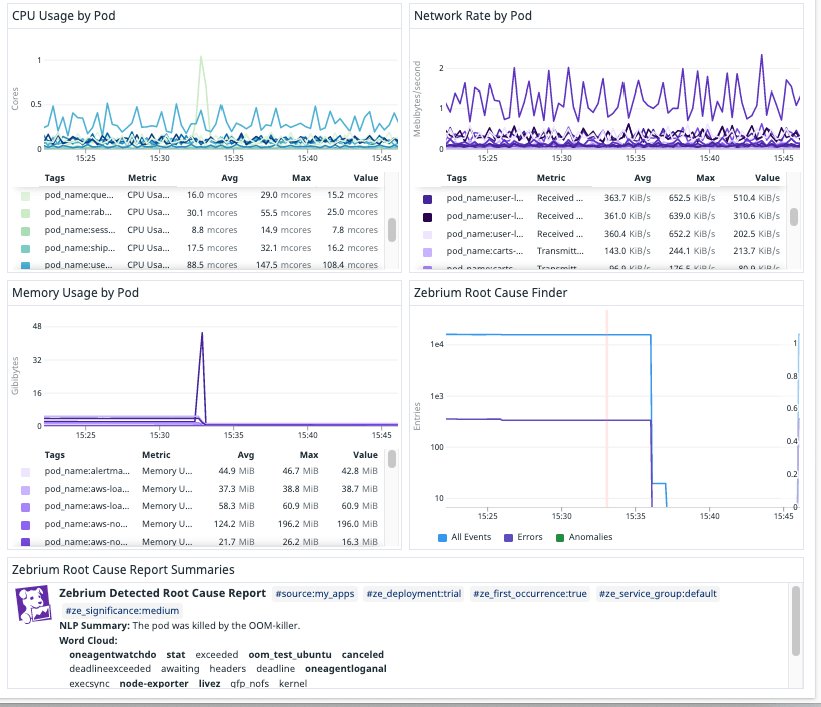
In this scenario, we used the same Sock Shop application, but this time ran a script that filled up memory on the node. Once again, the Datadog dashboard immediately picked up the symptoms. Although this scenario could be root caused without using the logs (e.g. by a user carefully drilling down into metrics and traces for instance), for this test we were trying to assess if autonomous log based features could catch the problem without any training or manual drill-down.
Once again, on the Datadog dashboard, immediately under the symptoms, we saw a Zebrium RCaaS report that lined up perfectly with the spikes in memory. The report pointed at the root cause keywords such as “oom_test” and “kernel”.
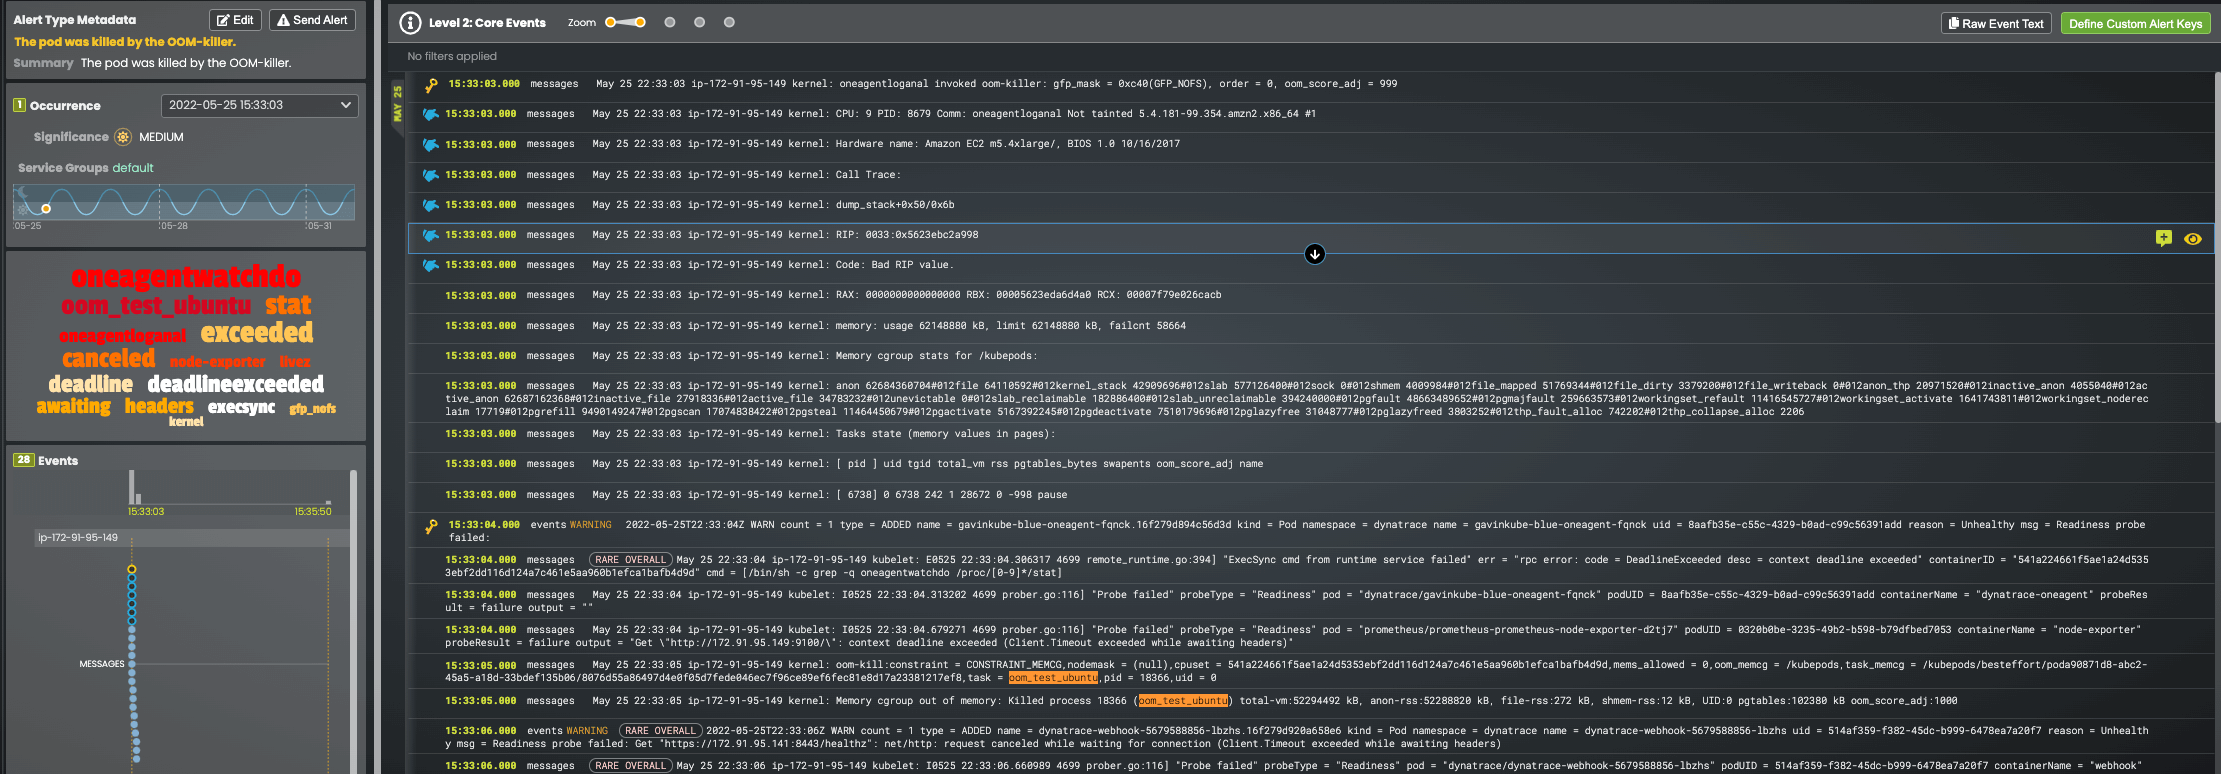
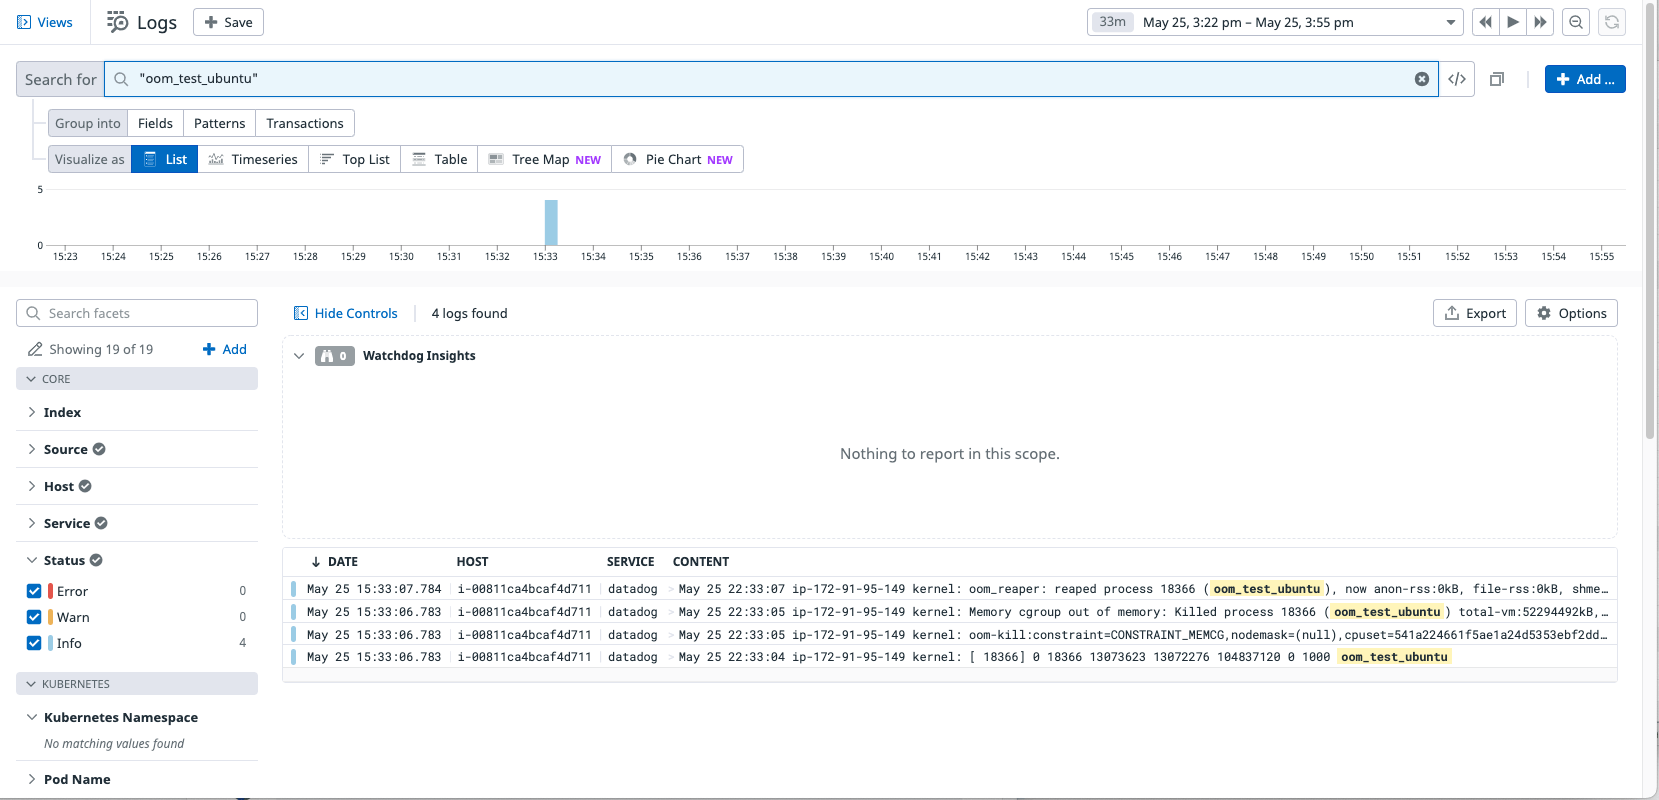
The full root cause report in the Zebrium UI once again is near perfect, identifying the oom_killer event and oom_test events that make it clear this is a memory starvation problem induced by an application called “oom_test”.
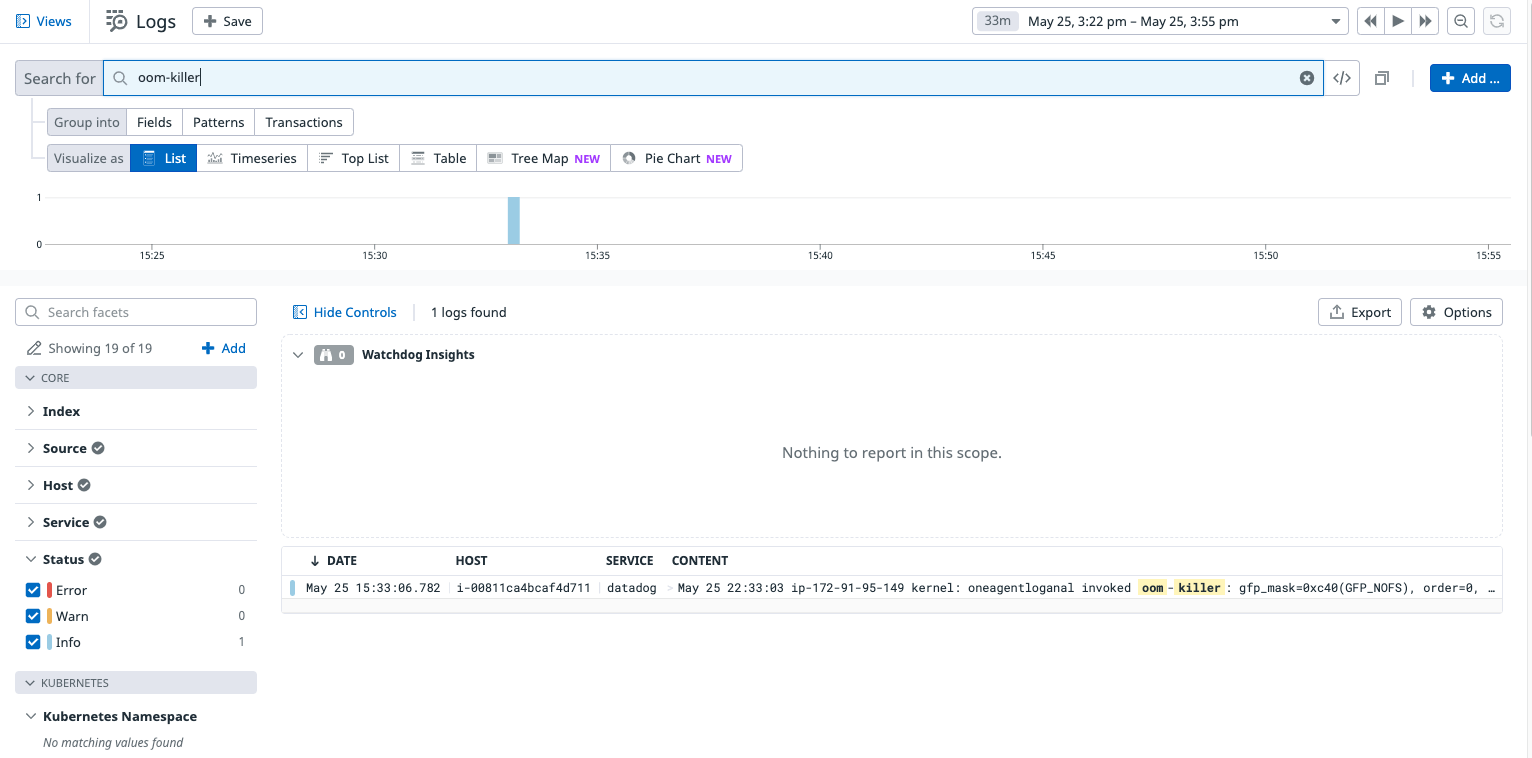
In comparison, Datadog’s Log Anomaly Detection did not pick up the root cause log events – in this case it did not pick up any anomalies in the relevant time period.
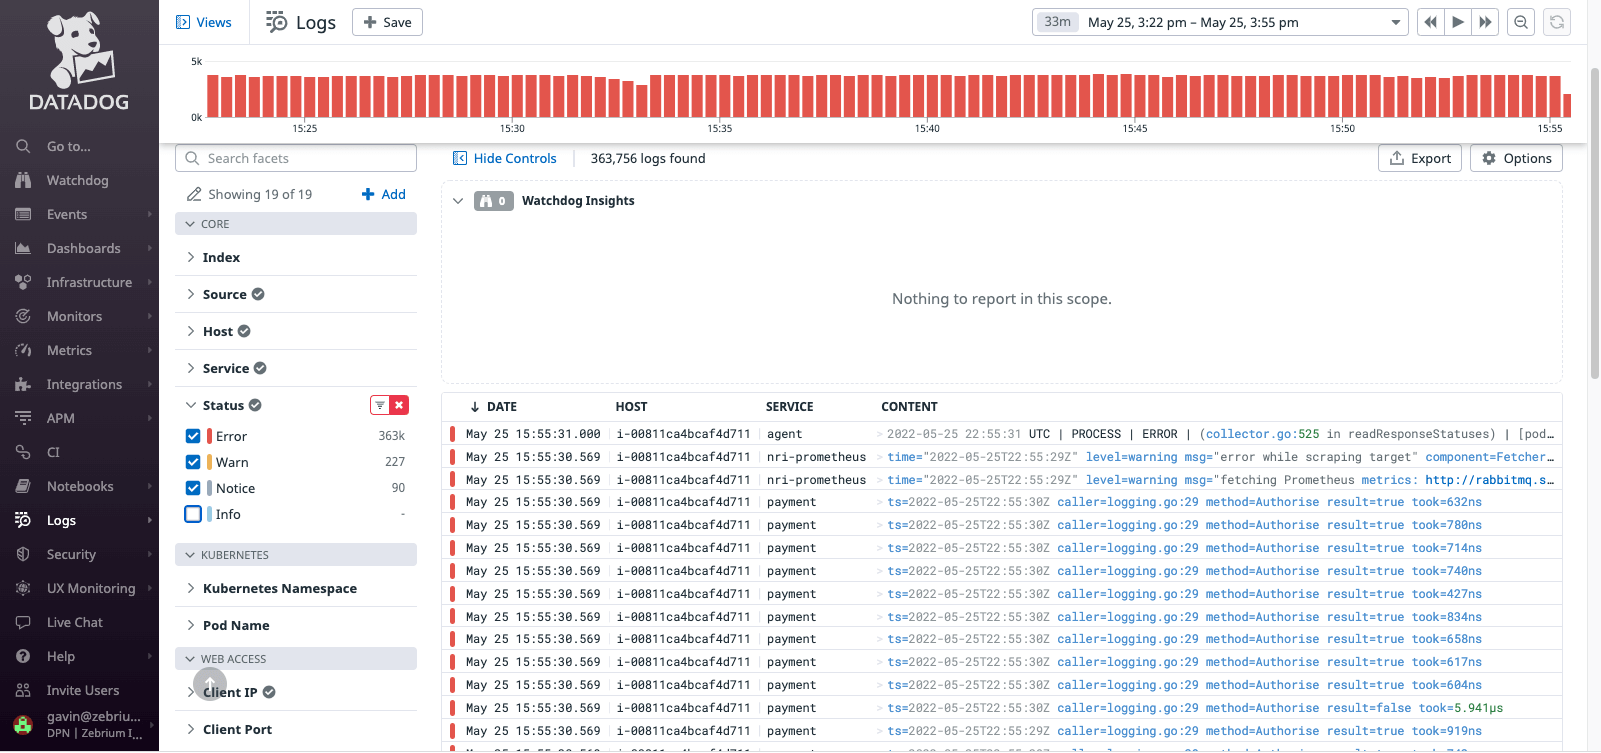
Also, once again, the key log events that should have been picked up were received by Datadog – they just weren’t being identified as root cause indicators.
Zebrium RCaaS is the Perfect Complement to Datadog
We see Zebrium’s Root Cause as a Service as a natural evolution from and complement to Datadog Watchdog Insights Log Anomaly Detection. Datadog’s Log Anomaly Detection is useful for specific types of anomalies, such as misbehaving endpoints in a webapp. Zebrium’s RCaaS is much wider in applicability, and doesn’t attempt to just find anomalies in the logs, it finds correlated patterns of anomalies that provide concise root cause reports with when a problem occurs. The Zebrium technology is relied upon by many industry leaders and has been third-party validated to correctly find the root cause in over 95% of incidents.
It’s natural to be skeptical about these claims, and so we encourage you try RCaaS in your own environment. It integrates natively with Datadog using either an events and metrics integration or a native Datadog app widget. In this way you can automatically see the root cause of an incident on any of your existing Datadog dashboards.
You can find details on Zebrium’s integration with Datadog here and can sign-up for a free trial or SaaS license in the Datadog Marketplace or on https://www.zebrium.com.
