We're thrilled to announce that Zebrium has been acquired by ScienceLogic!

Learn More

Troubleshoot
Problems
Faster


REQUEST A DEMO GET STARTED FREE


Automatic Root Cause Analysis

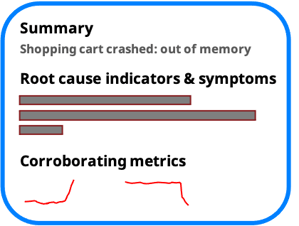
Humans troubleshoot software problems by hunting through logs, looking for errors and unexpected events. 

Let our machine learning do this for you by finding correlated anomalies in your logs, and turning them into simple to understand root cause reports.


HOW IT WORKS

Zebrium 60 second demo

Plain Language Root Cause Summaries

"The order failed because the system was running out of memory."


We use Generative AI to construct simple to understand root cause summaries. 


LEARN MORE

ML-Driven RCA when you know there's a problem

When you know there's a problem, automatically see its root cause in the Zebrium portal or inside your incident management tool.

Zebrium ML-generated root cause report

Proactive Detection when you don't

proactive software incident detection

Zebrium is always looking problems by scanning for anomalous patterns in your logs. You can use these to proactively catch incidents that aren't detected by other tools.

Even see Root Cause in your Incident Management Tool

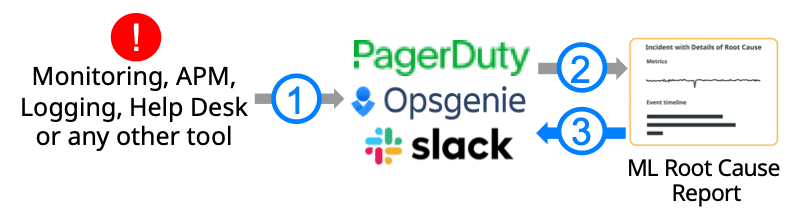
When a problem occurs and an incident is created in PagerDuty, Opsgenie or Slack, Zebrium will automatically update the open incident with a root cause report.

LEARN MORE

zebrium with incident management tool2


Standalone or Augment your Log Manager

Ways to implement Zebrium with your existing tools

Augment your log manager - Use your existing log manager for dashboarding and search, and let Zebrium automatically find root cause when you are troubleshooting a problem. 

Use with the Elastic Stack - With ZELK Stack, logs are sent to Zebrium using a Logstash output plugin. and root cause reports are sent back to Elasticsearch for viewing directly inside Kibana. 

Zebrium standalone -  Automatically see the core set of log events that explain the problem or zoom out to see an aggregated view of surrounding related error and anomaly events. You can also "peek" into any log stream to see what else is going on.

Zebrium is SOC 2 Type 1 Certified (1)


Platform Security

Zebrium adheres to industry best practices for security including: SOC 2 Type 1 certification, encryption of data in flight,  AES-256 encryption of data at rest, granular removal of sensitive records or fields, secure isolation of customer data and an option for a dedicated instance and VPC. All customer data will be deleted upon termination of service or upon request. For customers with the most stringent security requirements, there is also an on premises version. Read our security policy here.

Supported Platforms

Zebrium supported log collectors

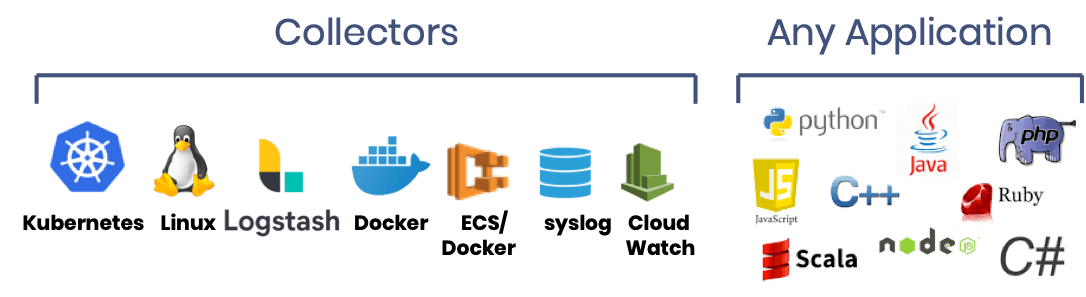
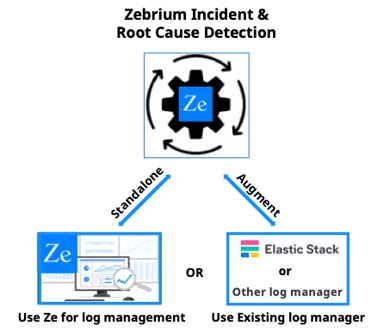
A CLI is also provided to upload individual log files. VMware, Windows and other common platforms available by using our Logstash integration.

Experience Zebrium for yourself

Get started in just a few minutes by installing our log collector or using a Logstash output plugin. For best results, please induce an app failure or you won't be able to experience automated root cause analysis. If you can't do that, try it with a sample microservices demo app.


GET STARTED FREE