"If you are sick of manually hunting through logs for the root cause, or sick of building and managing alert rules, you should try Zebrium with its AI and ML-based algorithms. It will likely save a lot of time and free you from the laborious task of creating lots of rules."
Super simple to get started
Just cut and paste a customized helm install command and you're all set for automatic root cause detection. Zebrium machine learning achieves accuracy within a day without any manual training.
Find root cause automatically
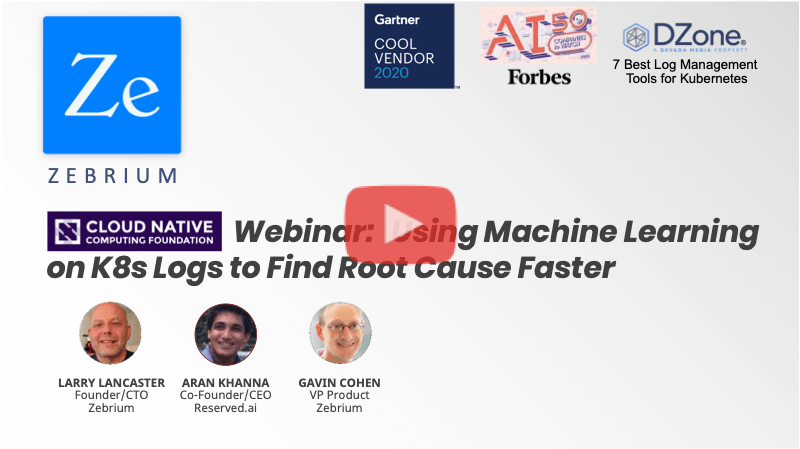
Kubernetes deployed apps can have complex failure modes that are hard to troubleshoot. Our machine learning proactively catches these failures and generates root cause reports. No more hunting through logs and dashboards.
Plain language root cause summaries
See a summary of what happened in plain English!
We use the GPT-3 language model to construct simple to understand summaries of the root cause reports our machine learning generates.
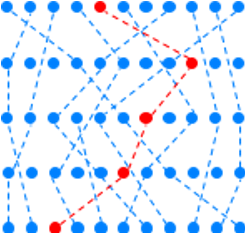
Zebrium machine learning works by finding hotspots of anomalous patterns across logs and Prometheus metrics. Our open source forked instance of Prometheus achieves near real-time metrics updates, captures labels for correlating with logs, handles out of order samples and achieves > 500x bandwidth reduction.
Try it now
Get started for free in a prod, dev or test K8s environment in less than 2 minutes.