We're thrilled to announce that Zebrium has been acquired by ScienceLogic!

Learn More

Zebrium Blog

Zebrium RCaaS: A Natural Evolution From Datadog Watchdog Insights Log Anomaly Detection

June 16, 2022 | Ajay Singh

Datadog is one of the most popular observability platforms today, and offers a rich set of capabilities including monitoring, tracing, log management, as well as machine learning (ML) features that help detect outliers. One of its most interesting feature sets falls under the Watchdog umbrella.

Read More

Observability: It's Time to Automate the Observer

June 15, 2022 | Larry Lancaster

Application monitoring is experiencing a sea-change. You can feel it as vendors rush to include the phrase "root-cause" in their marketing boilerplate. Common solutions enhance telemetry collection and streamline workflows, but that's not enough anymore. Autonomous troubleshooting is becoming a critical (but largely absent) capability for meeting SLOs, while at the same time it is becoming practical to attempt.

Application monitoring is experiencing a sea-change. You can feel it as vendors rush to include the phrase "root-cause" in their marketing boilerplate. Common solutions enhance telemetry collection and streamline workflows, but that's not enough anymore. Autonomous troubleshooting is becoming a critical (but largely absent) capability for meeting SLOs, while at the same time it is becoming practical to attempt. This profound transformation is the inevitable consequence of a few clear trends:

1.) Per-Incident Economics (the Motive) - Production incidents capable of impacting thousands of users in a short period of time are now commonplace. It's not enough anymore just to automate incident response based on lessons learned from the first occurrence of a new kind of problem, as was common in the shrink-wrap era, since the first occurrence alone can be devastating. These economics provide the motive for automating the troubleshooting step.

2.) Analytic Technologies (the Means) - It used to be cost- and effort-prohibitive to characterize and correlate metric, trace and log data, at scale, and in near-real-time. Ubiquitous access to fast storage and networks, as well as steady development of OLAP technologies and unsupervised learning algorithms, give us the means to address gaps with automation.

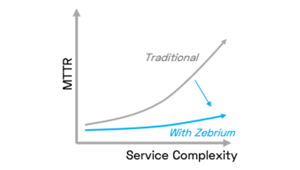
3.) The Troubleshooting Bottleneck (the Opportunity) - Runtime complexity (C) and operational data volume (V) continue to grow. The human eyeball is the bottleneck for troubleshooting, and it doesn't scale. As C and V grow linearly, MTTR for new/unknown/complex issues grows quadratically (~CV). This burgeoning time sink gives us the opportunity to tangibly improve troubleshooting with automation, and with ever-growing benefits into the future.

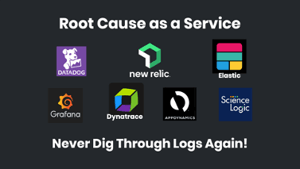
Root Cause as a Service (RCaaS)

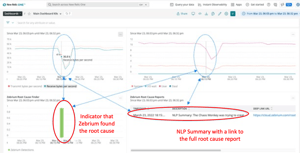
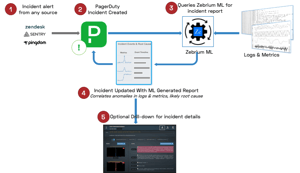
Because of these trends, we believe it's time for a generally useful, generally applicable RCaaS tool, and we believe we have built one. Zebrium delivers RCaaS, and here's what we mean by that: It’s proven (we’ll explain this later) and it delivers a fast-and-easy RCA experience, wherever and however you want it.

We believe that an autonomous troubleshooting tool should work in the general case, out of the box, stand-alone or in tandem with any other observability vendors' tools, and without exotic requirements (rules, training, etc.). The solution should be agnostic to observability stack or ingest method, and it shouldn't make assumptions about what stack you run or how you run it.

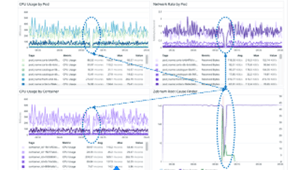
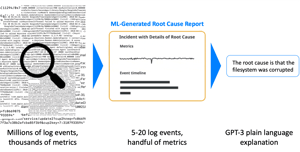
We've Started with Logs

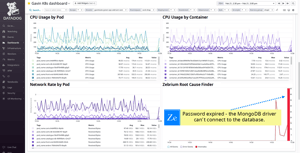
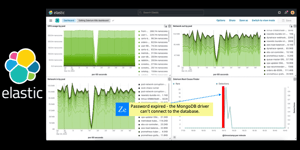
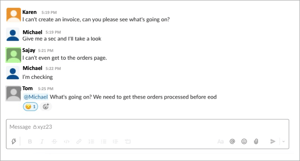
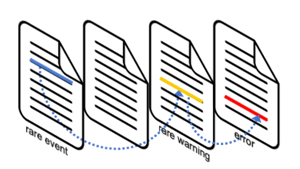
In any journey, you have to start somewhere. The founder of a well-known tracing company once said: "metrics give you when; traces give you where; logs give you why (the root cause)". It's not always true but, as a rule-of-thumb, it's not bad. Here's another, universally-heard rule-of-thumb: digging through logs to root-cause a new, unknown issue is one of the most dreaded experiences in DevOps today.

We believe if it has to do one thing well, an autonomous troubleshooting tool should find the same root-cause indicators from the logs that you were going to have to dig to find yourself. The solution should have first-class support for generic and unstructured logs, and it shouldn't require any parsers / alert rules / connectors / training / other configuration to work well.

We've Done the Hard Stuff

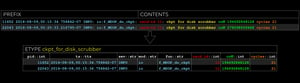
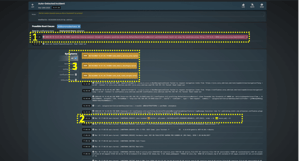
Supporting generic, unstructured logs by inferring their types and parameters correctly behind-the-scenes, is hard. Learning metadata from scratch, at ingest, custom to a particular deployment, is hard. Correlating anomalies across log streams to formulate RC reports, is hard. Summarizing such reports, is hard. These are all incredibly hard problems - but they were, in our view, necessary to accomplish generally useful, autonomous troubleshooting.

Why You Should Trust Us

Vendors have ruined the playing field by hyping "AI" / "ML" tools that don't work very well. Why should you trust that our tool can add value? Well, vendors generally don't present large-scale, quantitative, third-party studies of their tools' effectiveness in real-world scenarios across multiple stacks. We believe such studies are important criteria for buyers selecting tools, and we have such results to share with you.

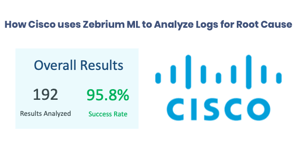
Cisco Systems wanted to know if they could trust the Zebrium platform before licensing it. They ran a multi-month study of 192 customer incidents across 4 very different product lines (such as Webex client and UCS server, among others). These incidents were chosen because they were the most difficult to root-cause, because they were solved by the most senior engineers, and because their root-cause was inferable from the logs.

Cisco found that Zebrium created a report at the right time, with the right root-cause indicators from the logs, over 95% of the time. You can read more details about this study here.

Aside from them, we have many satisfied customers, from petascale SaaS companies deploying into multiple GEOs with K8s, to MSPs monitoring windows farms, to enterprises troubleshooting massive production database applications.

Come on this Journey with Us

We've built something very special here. We're not trying to bamboozle you. We have real evidence from the real world that shows our tech works. We've built the first credible, accurate, third-party-proven tool that autonomously delivers root-cause from logs to the dashboard.

Want to run Zebrium in the cloud? We can do that. Want to run it on-prem? Our stack can be deployed on-prem with a chart. Want to monitor a modern cloud-native K8s environment? We have a chart for that too, and customers running K8s clusters with hundreds of nodes in multiple GEOs. We also support ingest via Fluentd, Logstash, Cloudwatch, Syslog, API and CLI, and we’re happy to expand our offerings to support our customers’ needs.

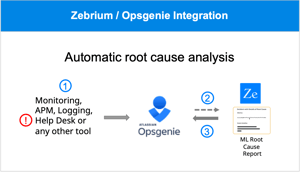
With support for dashboards from Datadog, New Relic, Dynatrace, Elastic/Kibana, Grafana, ScienceLogic, and AppDynamics, we’ll get you up-and-running with autonomous RCA feeding right into your existing monitoring workflow.

Sign up for a free trial from https://www.zebrium.com, or send us an email at hello@zebrium.com to arrange a purchase or PoC.


Read More

Speeding-up Root Cause Analysis with New Relic

May 3, 2022 | Ajay Singh

If you are a New Relic user, you’re likely using New Relic to monitor your environment, detect problems, and troubleshoot them when they occur. But let’s consider exactly what that entails and describe a way to make this entire process much quicker.

Read More

Using the Elastic Stack (ELK) For Observability? Here’s How to speed up Troubleshooting

April 8, 2022 | Ajay Singh

When troubleshooting, the bottleneck isn’t the speed of the Elastic queries – it is the human not knowing exactly what to search for, the time it takes to visually spot outliers and the hunt for bread crumbs that point to suspected problems. Read how ML can do all of this automatically.


The Elastic Stack (often called ELK) is one of the most popular observability platforms in use today. It lets you collect metrics, traces and logs and visualize them in one Kibana dashboard. You can set alerts for outliers, drill-down into your dashboards and search through your logs. But there are limitations. What happens when the symptoms of a problem are obvious – say a big spike in latency, or a sharp drop in network throughput - but the root cause is not as obvious? Usually that means an engineer needs to start scanning logs for unusual events and clusters of errors, to understand what happened. The bottleneck isn’t the speed of the Elastic queries – it is the human not knowing exactly what to search for, the time it takes to visually spot outliers and the hunt for bread crumbs that point to suspected problems.

Read More

Root Cause as a Service

March 22, 2022 | Ajay Singh

Now we’re adding an important element to our vision: “…to find the root cause from any problem source and deliver it to wherever it is needed”. So, if an SRE streams logs from hundreds of applications and uses Datadog to monitor them, the root cause found by Zebrium should automatically appear in Datadog dashboards aligned with other metrics charts.

Zebrium was founded with the vision of automatically finding patterns in logs that explain the root cause of software problems. We are well on track to delivering on this vision: we have identified the root cause successfully in over 2,000 incidents across dozens of software stacks, and a study by one of our large customers validated that we do this with 95.8% accuracy (see - How Cisco uses Zebrium ML to Analyze Logs for Root Cause).

Read More

How Cisco uses Zebrium ML to Analyze Logs for Root Cause

In this detailed study of 192 actual customer Service Requests, Zebrium’s machine learning was able to correctly identify the root cause in 95.8% of the cases. User feedback praised the quality of the root cause reports and experienced significant time savings compared to manual log analysis.

The Cisco Technical Assistance Center (TAC) has over 11,000 engineers handling 2.2 million Service Requests (analogous to incidents or support cases) a year. Although 44% of them are resolved in one day or less, many take longer because they involve log analysis to determine the root cause. This not only impacts the time a case remains open, but at Cisco’s scale, translates to thousands of hours spent each month analyzing logs.

Read More

Root Cause as a Service for Datadog

February 28, 2022 | Gavin Cohen

Datadog, like most other monitoring tools, is very effective at visualizing and providing drill-down on metrics, traces and logs. But when troubleshooting, considerable skill and expertise is required to interpret the data and determine the drill-down path to find the root cause. See how Zebrium's Root Cause as a Service simply shows you the root cause right on your Datadog dashboards.

There’s good reason Datadog is one of the most popular monitoring solutions available. The power of the platform is summed up in the tagline, “See inside any stack, any app, at any scale, anywhere” and explained in this chart:

Read More

Uncover Blind Spots in Your Monitoring

It’s the end of a quiet Friday and you’re about to finish up for the week when Slack starts going crazy. Orders aren’t being fulfilled and no one has any idea why. Read how Zebrium and AppDyanmics make this crisis go away!

Alert! Friday Fire Drill

It’s the end of a quiet Friday and you’re about to finish up for the week when Slack starts going crazy. Orders aren’t being fulfilled and no one has any idea why. 

Read More

Visualizing Root Cause Summaries from Logs

October 26, 2021 | Ajay Singh

Zebrium’s focus is to simplify the jobs of SREs, developers and support engineers who routinely troubleshoot problems using logs. Read about some of the new ways we are making Root Cause Reports more intuitive.


Read More

How to Try Zebrium ML-based RCA Using a Realistic Demo App

October 12, 2021 | Gavin Cohen

Zebrium uses machine learning on logs to automatically find the root cause of software problems. The best way to see it in action is with an application that is experiencing a failure. This blog shows you how to spin up a realistic demo app called Sock Shop, break the app using a chaos tool, and then see how Zebrium automatically finds the root cause. 

The best way to try Zebrium's machine learning is with an application that is experiencing a failure. This blog shows you how to spin up a single node Kubernetes cluster using Minikube, install a realistic demo app (Sock Shop), break the app using CNCF's Litmus Chaos engineering tool, and then see how Zebrium automatically finds the root cause of the problem. 

Read More

Using ML to Help Engineering and Support Teams Analyze Log Files

October 5, 2021 | Ajay Singh

A new use case has emerged: using our ML to analyze a collection of static logs. This is particularly relevant for technical support teams who collect “bundles” of logs from their customers after a problem has occurred. The results we’re seeing are nothing short of spectacular!


Zebrium’s technology finds the root cause of software problems by using machine learning (ML) to analyze logs. The majority of our customers stream their application and infrastructure logs to our platform for near real-time analysis. However, a new use case has emerged: using our ML to analyze a collection of static logs. This is particularly relevant for technical support teams who collect “bundles” of logs from their customers after a problem has occurred. The results we’re seeing are nothing short of spectacular!

Zebrium’s ML learns the normal patterns of all event types within the logs, and generates root cause reports when clusters of correlated anomalies and errors are detected. This is a great help for SREs, DevOps engineers and developers who are often under pressure to root cause problems as they happen.

However, there are many scenarios where you may not have a continuous stream of logs:

Read More

Log Anomaly Detection Using Machine Learning

June 21, 2021 | Larry Lancaster
At Zebrium, we have a saying: “Structure First”. We talk a lot about structuring because it allows us to do amazing things with log data. But most people don’t know what we mean when we say the “structure”, or why it is a necessity for accurate log anomaly detection.

At Zebrium, we have a saying: “Structure First”. We talk a lot about structuring because it allows us to do amazing things with log data. But most people don’t know what we mean when we say the “structure”, or why it is a necessity for accurate log anomaly detection.

Read More

Elasticsearch Machine Learning -An Improved Approach Using Correlated Anomaly Detection To Find Root Cause

June 2, 2021 | Gavin Cohen

Native machine learning for ElasticSearch was first introduced as an Elastic Stack (ELK Stack) feature in 2017. It came from Elastic's acquisition of Prelert, and was designed for anomaly detection in time series metrics data. The Elastic ML technology has since evolved to include anomaly detection for log data. So why is a new approach needed for Elastic Stack machine learning?

Native machine learning for ElasticSearch was first introduced as an Elastic Stack (ELK Stack) feature in 2017. It came from Elastic's acquisition of Prelert, and was designed for anomaly detection in time series metrics data. The Elastic ML technology has since evolved to include anomaly detection for log data. So why is a new approach needed for Elastic Stack machine learning?

Read More

Log Analysis with Machine Learning: An Automated Approach to Analyzing Logs Using ML/AI

May 20, 2021 | David Gildeh

When a new/unknown software problem occurs, chances are an SRE or developer will start by analyzing and searching through logs for root cause - a slow and painful process. So it's no wonder using machine learning (ML) for log analysis is getting a lot of attention. 

When a new/unknown software problem occurs, chances are an SRE or developer will start by analyzing and searching through logs for root cause - a slow and painful process. So it's no wonder using machine learning (ML) for log analysis is getting a lot of attention. 


Read More

What if RCA was done for you in Opsgenie?

May 3, 2021 | Gavin Cohen

We all know the drill. Sun, warm water, tranquility, silence, zzzz... Then your phone blares and buzzes, violently waking you from sleep. It’s dark and you quickly leave the dream behind. With blurry eyes you read, “AppDynamics Alert: shopping_cart_checkout”. Damn, that’s the service that was upgraded this afternoon.

We all know the drill. Sun, warm water, tranquility, silence, zzzz... Then your phone blares and buzzes, violently waking you from sleep. It’s dark and you quickly leave the dream behind. With blurry eyes you read, “AppDynamics Alert: latency threshold exceeded on page: shopping_cart_checkout”. Damn, that’s the

Read More

3 ways ML is a Game Changer for your Incident Management Lifecycle

April 9, 2021 | Ajay Singh

Any developer, SRE or DevOps engineer responsible for an application with users has felt the pain of responding to a high priority incident. Read about 3 ways that ML can be a game changer in the incident management lifecycle.

Any developer, SRE or DevOps engineer responsible for an application with users has felt the pain of responding to a high priority incident. There’s the immediate stress of mitigating the issue as quickly as possible, often at odd hours and under severe time pressure. There’s the bigger challenge of identifying root cause so a durable fix can be put in place. There’s the aftermath of postmortems, reviews of your monitoring and observability solutions, and inevitable updates to alert rules. And there’s the typical frustration of wondering what could have been done to avoid the problem in the first place.

In a modern cloud native environment, the complexity of distributed applications and the pace of change make all of this ever harder. Fortunately, AI and ML technologies can help with these human-driven processes. Here are three specific ways:

Read More

Real World Examples of GPT-3 Plain Language Root Cause Summaries

March 23, 2021 | Ajay Singh

Zebrium’s unsupervised ML identifies the root cause of incidents and generates concise reports (typically between 5-20 log events). Using GPT-3, these are distilled into simple plain language summaries. This blog presents some real examples of the effectiveness of this approach.


Read More

The Root Cause Experience

February 22, 2021 | Roy Selig

More than two years ago, the Zebrium UI team embarked on designing an experience around our Machine Learning (ML) engine, which was built to find the root cause of critical issues in logs so users wouldn't have to ... and the root cause experience was born!

More than two years ago, the Zebrium UI team embarked on designing an experience around our Machine Learning (ML) engine, which was built to find the root cause of critical issues in logs so users wouldn't have to. We knew our approach could cut Mean Time to Resolution (MTTR) from hours to minutes. But the idea of ML was foreign to users coming from the logging world, people who often relied on clever manual searching to do their jobs. To make them comfortable, our UI was built as a log viewer with ML features added around it.  We had good success with that approach. But the utility of our UI was often measured by the quality of our search capability, not the quality of our ML. It wasn't until we focused the UI on what we do best, root cause detection through ML, that our users fully understood our value proposition... and the root cause experience was born!

Read More

Lessons from Slack, GCP and Snowflake outages

February 4, 2021 | Ajay Singh

An outage at a market leading SaaS company is always noteworthy. Thousands of organizations and millions of users are so reliant on these services that a widespread outage feels as surprising and disruptive as a regional power outage. The crux of the problem is we expect SaaS services to innovate relentlessly. Although they employ some of the best engineers, sophisticated observability strategies and cutting-edge DevOps practices, SaaS companies also have to deal with ever accelerating change and growing complexity.


Read More

Using GPT-3 for plain language incident root cause from logs

January 9, 2021 | Larry Lancaster

This project is a favorite of mine and so I wanted to share a glimpse of what we've been up to with OpenAI's amazing GPT-3 language model. Today I'll be sharing a couple of straightforward results.


Plain Language root cause summaries. Try it for free!
GET STARTED FREE


This project is a favorite of mine and so I wanted to share a glimpse of what we've been up to with OpenAI's amazing GPT-3 language model. Today I'll be sharing a couple of straightforward results. There are more advanced avenues we're exploring for our use of GPT-3, such as fine-tuning (custom pre-training for specific datasets); you'll hear none of that today, but if you're interested in this topic, follow this blog for updates.


You can also see some real-world results from our customer base here.

Read More

Try ML-driven RCA using a cloud-native microservices demo app

December 16, 2020 | Gavin Cohen

There is no better way to try Zebrium ML incident and root cause detection than with a production application that is experiencing a problem. The machine learning will not only detect the problem, but also show its root cause. But no user wants to induce a problem in their app just to experience the magic of our technology! So, although it's second best, an alternative is to try Zebrium with a sample real-life application, break the app and then see what Zebrium detects.

*** A new version of this blog that uses a more realistic way to inject an error can be found here. ***


There is no better way to try ML-driven root cause analysis than with a production application that is experiencing a problem. The machine learning will not only detect the problem, but also show its root cause. But no user wants to induce a problem in their app just to experience the magic of our technology! So, although it's second best, an alternative is to try Zebrium with a sample real-life application, break the app and then see what Zebrium detects. One of our customers kindly introduced us to Google's microservices demo app - Online Boutique


Read More

ZELK vs ELK: Zebrium vs Elastic Machine Learning

October 25, 2020 | Gavin Cohen

We often get asked how Zebrium ZELK Stack machine learning (ML) compares to native ML for Elasticsearch. The easiest way to answer this is to see the two technologies side by side. No manual training, rules or special configuration were used for either ZELK or ELK.

We often get asked how Zebrium ZELK Stack machine learning (ML) compares to native ML for Elasticsearch. The easiest way to answer this is to see the two technologies side by side. This short (3 minute) video demonstrates what each solution is able to uncover from the exact same log data. No manual training, rules or special configuration were used for either ZELK or ELK.

Read More

Zebrium Named a 2020 Gartner Cool Vendor

October 22, 2020 | Gavin Cohen

Zebrium has been recognized by Gartner as one of four vendors in the report, "Cool Vendors in Performance Analysis", by Padraig Byrne, Federico De Silva, Pankaj Prasad, Venkat Rayapudi & Gregg Siegfried, October 5 2020. 

The past three months has seen Zebrium reach several major milestones! We moved from beta to production and our platform is now in use by industry leading customers who rely on Zebrium to keep their production applications running. We were named in the Forbes AI50 list as one of "America’s Most Promising Artificial Intelligence Companies". We were written up in DZone as one of the "7 Best Log Management Tools for Kubernetes". We added the capability to augment other logging and monitoring tools, and we recently released ZELK Stack - software incident and root cause detection for Elastic Stack (ELK Stack).

Read More

Virtual tracing: A simpler alternative to distributed tracing for troubleshooting

July 21, 2020 | Larry Lancaster

Distributed tracing is commonly used in Application Performance Monitoring (APM) to monitor and manage application performance, giving a view into what parts of a transaction call chain are slowest. It is a powerful tool for monitoring call completion times and examining particular requests and transactions.

The promise of tracing

Distributed tracing is commonly used in Application Performance Monitoring (APM) to monitor and manage application performance, giving a view into what parts of a transaction call chain are slowest. It is a powerful tool for monitoring call completion times and examining particular requests and transactions.

Read More

Zebrium can Augment PagerDuty Incidents

July 17, 2020 | Rod Bagg

PagerDuty is a leader in Incident Response and on-call Escalation Management. There are over 300 integrations for PagerDuty to analyze digital signals from virtually any software-enabled system to detect and pinpoint issues across your ecosystem. When an Incident is created, PagerDuty will mobilize the right team in seconds (read: this is when you get the "page" during your daughter's 5th birthday party).

I wanted to give you an update on my last blog on MTTR by showing you our PagerDuty Integration in action.

As I said before, you probably care a lot about Mean Time To Detect (MTTD) and Mean Time To Resolve (MTTR). You're also no doubt familiar with monitoring, incident response, war rooms and the like. Who of us hasn't been ripped out of bed or torn away from family or friends at the most inopportune times? I know firsthand from running world-class support and SRE organizations that it all boils down to two simple things: 1) all software systems have bugs and 2) It's all about how you respond. While some customers may be sympathetic to #1, without exception, all of them still expect early detection, acknowledgment of the issue, and near-immediate resolution. Oh, and it better not ever happen again!

Read More

You've Nailed Incident detection, what about Incident Resolution?

June 3, 2020 | Rod Bagg

You probably care a lot about Mean Time To Detect (MTTD) and Mean Time To Resolve (MTTR). You're also no doubt familiar with monitoring, incident response, war rooms and the like. Imagine if you could automatically augment an incident detected by any monitoring, APM or tracing tool with details of root cause?

If you're reading this, you probably care a lot about Mean Time To Detect (MTTD) and Mean Time To Resolve (MTTR). You're also no doubt familiar with monitoring, incident response, war rooms and the like. Who of us hasn't been ripped out of bed or torn away from family or friends at the most inopportune times? I know firsthand from running world-class support and SRE organizations that it all boils down to two simple things: 1) all software systems have bugs and 2) It's all about how you respond. While some customers may be sympathetic to #1, without exception, all of them still expect early detection, acknowledgement of the issue and near-immediate resolution. Oh, and it better not ever happen again!

Read More

Is Log Management Still the Best Approach?

May 29, 2020 | Gavin Cohen

Part of our product does what most log managers do: aggregates logs, makes them searchable, allows filtering, provides easy navigation and lets you build alert rules. So why write this blog? Because in today’s cloud native world, while useful, log managers can be a time sink when it comes to detecting and tracking down the root cause of software incidents.

Disclosure – I work for Zebrium. Part of our product does what most log managers do: aggregates logs, makes them searchable, allows filtering, provides easy navigation and lets you build alert rules. So why write this blog? Because in today’s cloud native world (microservices, Kubernetes, distributed apps, rapid deployment, testing in production, etc.) while useful, log managers can be a time sink when it comes to detecting and tracking down the root cause of software incidents.

Read More

Beyond Anomaly Detection – How Incident Recognition Drives down MTTR

May 19, 2020 | Ajay Singh

Monitoring is about catching unexpected changes in application behavior. Traditional monitoring tools achieve this through alert rules and spotting outliers in dashboards. While this traditional approach can typically catch failure modes obvious service impacting symptoms, it has several limitations.

The State of Monitoring

Monitoring is about catching unexpected changes in application behavior. Traditional monitoring tools achieve this through alert rules and spotting outliers in dashboards. While this traditional approach can typically catch failure modes with obvious service impacting symptoms, it has two limitations:

Read More

Busting the Browser's Cache

A new release of your web service has just rolled out with some awesome new features and countless bug fixes. A few days later and you get a call: Why am I not seeing my what-ch-ma-call-it on my thing-a-ma-gig? After setting up that zoom call it is clear that the browser has cached old code, so you ask the person to hard reload the page with Ctrl-F5. Unless its a Mac in which case you need Command-Shift-R. And with IE you have to click on Refresh with Shift. You need to do this on the other page as well. Meet the browser cache, the bane of web service developers!


Read More

Is Autonomous monitoring the anomaly detection you actually wanted?

April 15, 2020 | Larry Lancaster

Automatically Spot Critical Incidents and Show Me Root Cause

That's what I wanted from a tool when I first heard of anomaly detection. I wanted it to do this based only on the logs and metrics it ingests, and alert me right away, with all this context baked in...

Automatically Spot Critical Incidents and Show Me Root Cause

Read More

FREE SIGN-UP