We're thrilled to announce that Zebrium has been acquired by ScienceLogic!
Learn More
Today's applications are evolving faster, growing more complex and failing in new ways. Although most organizations are able to tell when an application breaks, finding the root cause typically involves the time-consuming task of hunting through dashboards and logs to piece together what happened. Fortunately, unsupervised machine learning can be applied to logs and metrics to automatically uncover the root cause of software incidents.
If you you don't have time to read the full whitepaper now, please try it for yourself using your own logs or following our step-by-step instructions to install and break a sample microservices app.
Modern applications are evolving faster, growing more complex and becoming increasingly distributed. But they’re also failing in new ways, and while most organizations are able to tell when an application breaks, finding the root cause is another matter. Traditional troubleshooting approaches rely on a combination of human instinct and slow, manual searches in conjunction with observability tools. But this is reactive and time intensive, hurting productivity and Mean-Time-To-Resolution (MTTR).
Machine learning (ML) can do much better – detecting correlated anomalous patterns automatically and creating highly diagnostic incident reports that shorten time to resolution – without requiring human supervision or configuration. But simple approaches to anomaly detection will not get us there. This white paper describes some of the limitations of traditional approaches and discusses newer approaches that are able to achieve significantly better results.
Metrics and logs are the two most common data sources used to detect and troubleshoot application problems.
Important metrics are typically tracked via dashboards, with alerts used selectively to generate incidents when certain “symptom” metrics deviate from their healthy range.
Anomaly detection can be an improvement over setting static metric thresholds, by utilizing forecast/outlier models, often taking seasonality and other variations into account. However, traditional metric anomaly implementations still require a human to curate which metrics will be tracked and then to pick the best models to avoid false positives.
Whether alerts are generated using anomaly detection or static metrics thresholds, when an incident is detected, DevOps, SREs or engineers still need to manually drill down into other metrics and logs to determine root cause.
Historically, logs have been collected and used mostly for reactive troubleshooting of issues detected by other monitoring and alerting tools. The troubleshooting process itself involves a combination of experience, intuition and skill as engineers iteratively search through huge volumes of logs, looking for clues that help to pinpoint the root cause.
A troubleshooting session typically starts by searching for errors with the goal of finding something that explains the problem. This might be followed by a scan for new or rare log events, unexpected events or unusual patterns. This human-driven process can be extremely time consuming and doesn’t scale with size or complexity. And it’s only getting worse as the move towards move towards cloud, container and microservices architectures drives up the complexity and number of log sources and log lines being generated.
We are already spending significant cost and effort to collect and store logs in a central log management solution that is mostly used for search. However, since logs often contain the best narrative of a problem, there is huge potential to also use logs to proactively notify users of new/unknown or potential problems.
If there were a way to detect these problems automatically, a tool could produce a low priority (“P3”) incident feed that could be used to catch issues early or find potential problems before they impact users. Some tools (for example the Elastic Stack with the machine learning option) attempt to highlight anomalies in logs using machine learning, but in practice they produce very noisy results.
Fortunately, new machine learning approaches are being developed to solve this problem (see comparison here). They automatically detect patterns in logs and metrics to catch incidents and correlate them with the root cause. These approaches are built to work at scale and have the potential to turn logs into a more proactive solution, that not only automatically detects incidents, but also takes us directly to the root cause when an incident occurs.
Because there are many vendors entering the AI space, it can be hard to cut through the noise and understand which technologies work best in real-world situations. This paper explains the approach taken by Zebrium to develop machine learning for logs and metrics, and why it presents a superior approach over existing methods.
Using Machine Learning on Logs and Metrics
As mentioned above, metrics anomaly detection can be a useful tool to detect application health incidents, with the metrics anomalies serving as symptoms of the incident.
Traditional time series anomaly detection is designed to track handpicked metrics, using carefully curated approaches such as closest neighbor, local outlier factor (LOF), or moving average (ARMA) based outliers. This can help catch problems in critical user facing metrics. But it has downsides:
Zebrium has taken a very different approach. Instead of requiring a user to handpick the right metrics and the right outlier algorithms, it takes advantage of the fact that when software incidents occur, any anomalous metrics are probably useful to help explain the problem. And often there will be multiple correlated anomalous metrics. For example, memory contention on a node will impact multiple containers resulting in multiple anomalous memory metrics. But you might also see anomalous disk latency metrics (due to increased swapping because of a memory shortage), etc. Similarly, network bottlenecks can impact latency for many operations which show up in multiple metrics.

What makes Zebrium’s approach possible is that it uses logs, or an external signal, to know when there is a problem. It then looks for unusually correlated metric anomalies. This achieves superior results to other approaches that focus on catching just one anomaly in one metric.
The Zebrium approach can also act on all metrics, not just a handpicked few. And it no longer requires extensive curation or tuning of the algorithms – just detecting new max, min, plateaus and sharp changes is enough. Finally, the anomalous metrics that Zebrium catches tend to be extremely helpful when presented with correlated anomalous log events, to help explain the root cause of an incident.
As mentioned above, logs are typically the most valuable data source for explaining the root cause of a software problem. Therefore, the ideal goal for an ML system that works on logs, is for it to be able to automatically find the root cause of a problem just by analyzing a given log data set (assuming, of course, the log data set contains enough relevant information).
Before explaining the approach Zebrium has taken, it’s useful explore the problem space in general as well as other attempts and approaches to solving the problem.
ML in general uses statistical models to make predictions. For monitoring logs, a useful prediction would be the ability to classify whether a particular log event, or set of events, are causing a real incident that requires action to resolve. Another useful prediction would be to correlate an incident to the root cause so users can easily rectify the issue.
In ML, usually the more data available, the more accurate the ML model will be at making predictions. This is why models usually become more accurate over time. However, this has two challenges – it leads to a long lead time to value, i.e. the system requires several days or weeks of data to serve accurate predictions and not raise false alerts (also referred to as “false positives”).
Worse, slow learning ML is actually not very useful when the behavior of the application itself keeps changing, for example because frequent updates are being deployed for each of its microservices. If the accuracy is poor, then we eventually will start ignoring the model as it will generate too many spammy alerts.
There are also two main approaches for training ML models on existing data: supervised and unsupervised. Supervised training requires a labelled data set, usually produced manually by humans, to help the model understand the cause and effect of the data. For example, we may label all log events that relate to a real incident so the model will recognize that incident again if it sees the same log events or pattern.
As you can imagine, this can take a lot of effort, especially considering the millions of potential failure modes complex software services can generate. Therefore, another approach used to train ML models, is Unsupervised training. In this approach, the model will try and figure out patterns and correlations in the data set by itself, which can then be used to serve predictions.
The challenge with using ML with logs, however, is every environment is different. Although there may be some common third-party services shared between environments (e.g. open source components like MySQL, NGinX, Kubernetes, etc.), there will likely also be custom applications that are unique to a particular environment and generating a unique stream of logs and patterns.
This means that any approach that needs to be trained on an environment’s specific data will not work unless the other environments run the same components. In addition, unless we want to invest a lot of resources and time for humans to accurately label the data, the models must be able to train unsupervised.
Another challenge is any ML approach needs to determine how to be accurate at predictions quickly and with limited data, to ensure the user isn’t waiting days or weeks for accurate root causes to be generated.
With these challenges in mind, we need an ML solution that can train quickly on a relatively small data set, and do this unsupervised, to ultimately generate accurate root cause reports and incident predictions across unique environments. It should also keep evolving its learning as an application continually evolves.
While there have been a lot of academic papers on the subject, the approaches typically fall into two categories which are explained below:
This category refers to algorithms that have been designed to detect anomalous patterns in string-based data. Two popular models in this category are Linear Support Vector Machines (SVM) and Random Forrest.
Using SVM as an example, it classifies the probability that certain words in a log line are correlated with an incident. Some words such as “error” or “unsuccessful” may correlate with an incident and receive a higher probability score than other words such as “successful” or “connected”. The combined score of the message is used to detect an issue.
Both SVM and Random Forrest models use supervised learning for training and require a lot of data to serve accurate predictions. As we discussed earlier, unless we are only running common 3rd party software, where we can collect and label a lot of common log samples for training, this approach will not work well in new environments running bespoke custom software, as the models need to be trained on a large labelled data set from the new log samples generated by that specific environment.
These approaches also try to do anomaly detection using the raw log event messages. This may work well for individual log events but will be far too noisy to only detect real incidents. When incidents occur, we need to detect pattern changes across the entire log set, and not look for issues in individual log events.
Deep Learning
Deep learning is a very powerful form of ML, generally called Artificial Intelligence (AI). By training neural networks on large volumes of data, Deep Learning can find patterns in data, but generally is used with Supervised training using labeled datasets. AI has been used for hard problems such as image and speech recognition with great results.
One of the best academic papers for this approach is the Deeplog paper from the University of Utah, which uses deep learning to detect anomalies in logs. Interestingly, they have also applied ML to parse logs into event types, which is similar to Zebrium’s approach discussed later, as this significantly improves the accuracy of the anomaly detection.
The challenge with this approach again, is that it requires a large volume of data to become accurate. Which means new environments will take longer before they can serve accurate predictions, and smaller environments may never produce enough data for the model to be accurate enough.
However, unlike the statistical algorithms discussed previously, another issue with Deep Learning is it is very compute intensive to train. Many data scientists will run expensive GPU instances to train models quicker, but at significant cost. If we need to train the model on every unique environment individually, and continuously over time, this would be an extremely expensive way to detect incidents autonomously, and therefore this approach is not recommended for monitoring logs for environments running custom software.
While there are many ways to find interesting anomalies in logs, if we want to detect the root cause of real incidents accurately, it’s important to understand the nature of an incident. Generally, an incident creates a change of pattern in several types of log event over a short window of time. For example, an incident will often start with a rare event and be followed by other unusual patterns of errors or warnings (often spanning several different log streams). This in turn means we need to reliably learn the pattern of each event type and then detect when these patterns change. In order to do this, we first need to be able to precisely distinguish unique event types. Once event types can be identified, we need to learn their patterns and detect when correlated patterns change in a way that indicates an incident has occurred.
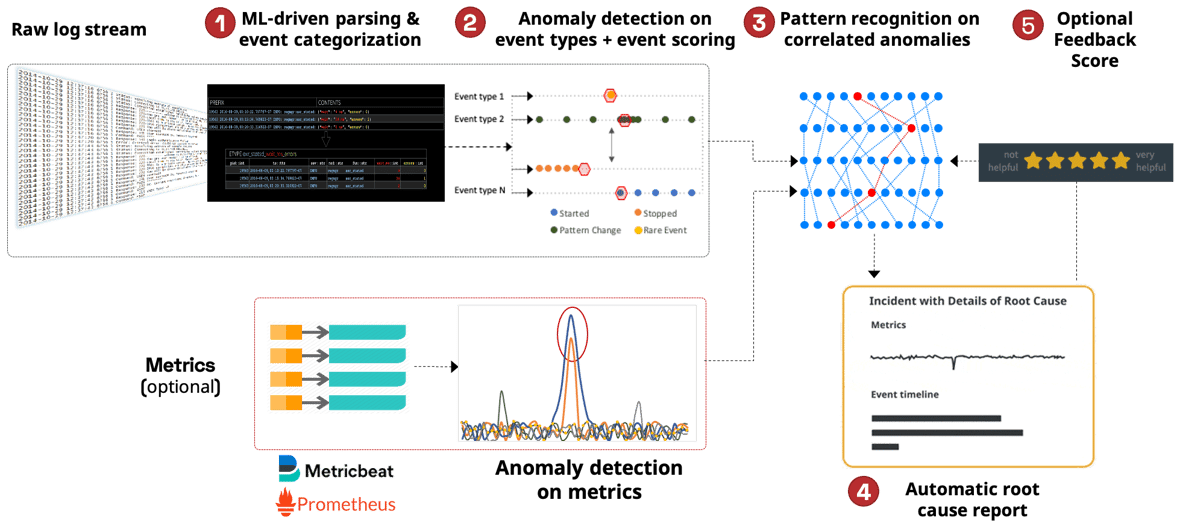
Therefore, we need a multi-layered approach for detecting incidents and their patterns, each of which must operate completely unsupervised:
The foundational step is to automatically parse the structure of the raw logs and build a dictionary of distinct event types. This uses machine learning and can start creating the dictionary of event types after only seeing a few hundred lines from a log. It’s also smart enough to adapt to changing event structures – e.g. when a developer adds a parameter to an event or changes the spelling of a word. It automatically identifies any event changes and updates the dictionary to reflect the changes over time:
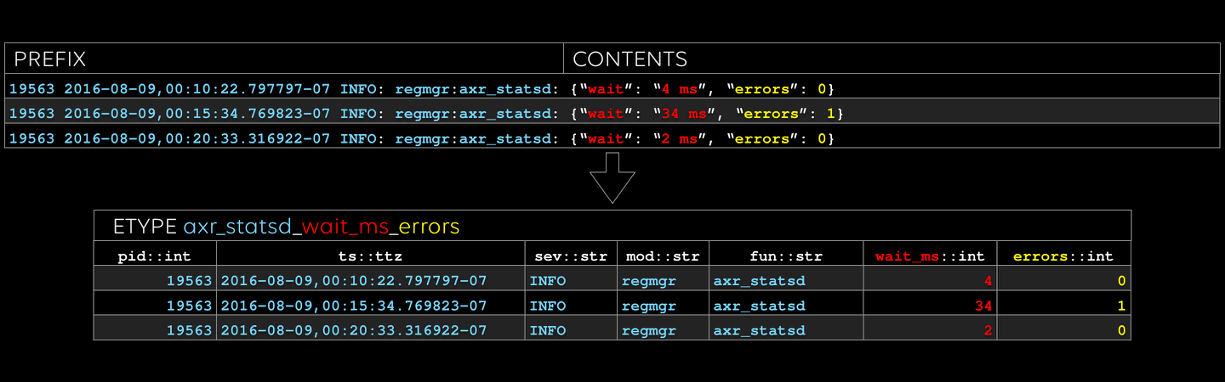 Fig 2: Automated parsing of raw logs to event types
This step essentially normalizes billions of raw log events into only a few thousand unique event types. This means we can now learn the patterns of each event type in the logs. Does an event type have a heartbeat and repeat regularly? Does an event correlate in a similar pattern every time another event is triggered? Is this the first time an event of this type has occurred? Etc.
This phase also automatically recognizes and parses fields (variables) in a log message, so we can also perform anomaly detection on field values. This has the added benefit of allowing us to run SQL analytics queries across all logs to build reports on specific fields without having to write a single parsing rule.
 Fig 3: Raw logs organized into database columns with fields automatically extracted
A deeper explanation of how Zebrium’s log parsing works can be found here, but essentially, because the frequency of different log event messages can widely vary, a range of algorithms are applied to automatically recognize and parse log messages into unique event types. Some algorithms work well for low frequency event messages, others work best for high frequency event messages. Zebrium will automatically select the best algorithm to parse the messages and adapt to the current frequency of the messages in the logs.
Only once the logs have been normalized, can we then start applying accurate anomaly detection algorithms to each event type.
For each event type, a statistical method called a Point Process is used to model the characteristics of the event type such as its rate, periodicity and frequency seen in the logs.
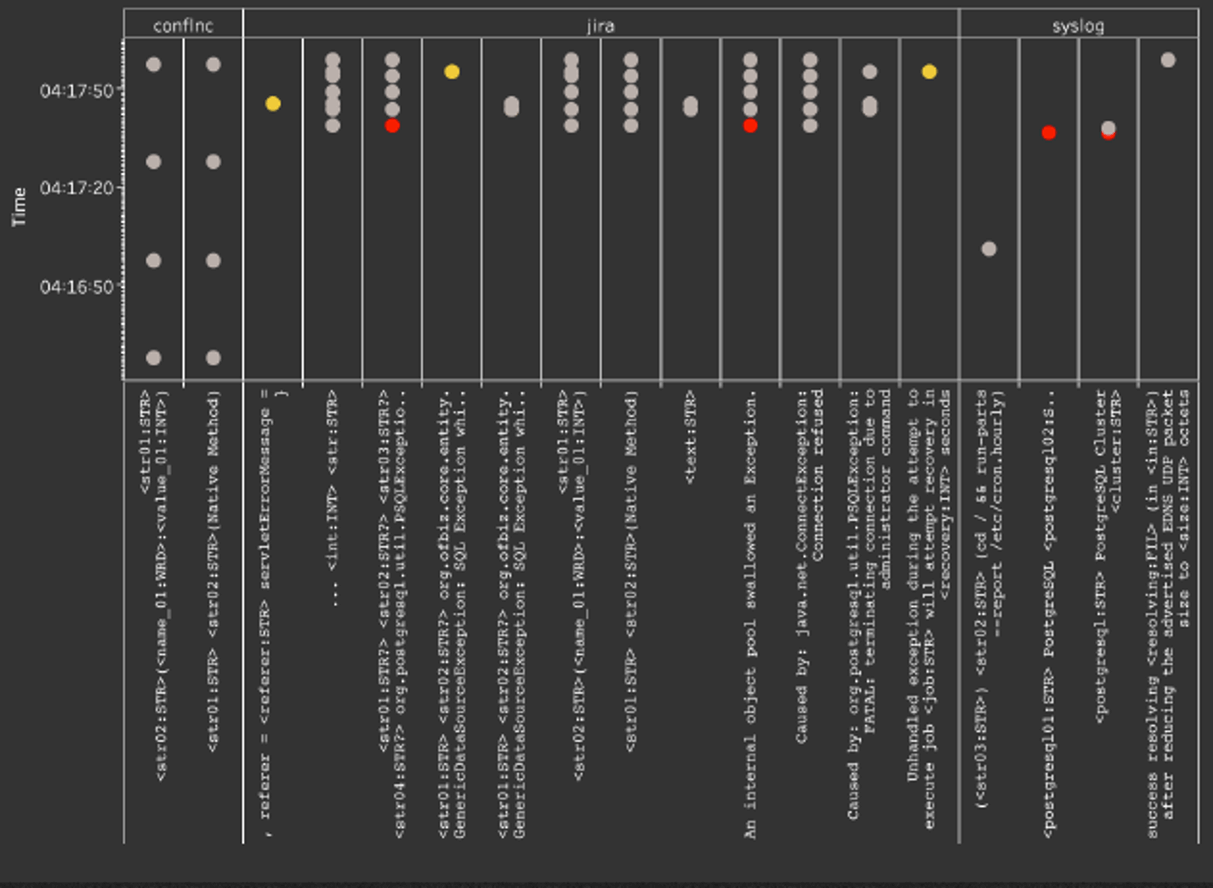 Fig 4: Point Process Analysis of Event Types
Because it recognizes patterns for specific event types, and not the raw log messages themselves, it also allows Zebrium to detect anomalous patterns like a regular event (heartbeat) stopping. For example, in this Stripe incident two database nodes stopped reporting replication metrics four days prior to an outage, but the problem went undetected until a failover event triggered an outage. This would have been easy to detect with Zebrium’s approach.
This step will produce a scored stream of anomalies for each event type which can then be used by the next step to detect patterns across the anomalies which indicate an actual incident.
Logs are vast and noisy. There will always be anomalies in logs, so relying on a list of anomalous events would make for a very noisy signal. However, in real incidents, a change of log pattern will typically occur in multiple places (e.g. across containers or across different parts of an application). For example, a new or rare event might occur in one log stream, followed by a change in frequency of another event type in a different log stream, and an error or warning in yet another stream.
Therefore, another layer of ML is used to detect hotspots of abnormally correlated anomalous patterns. To achieve this, Zebrium uses a different ML model that is able to detect and group together these abnormally correlated patterns across the logs.
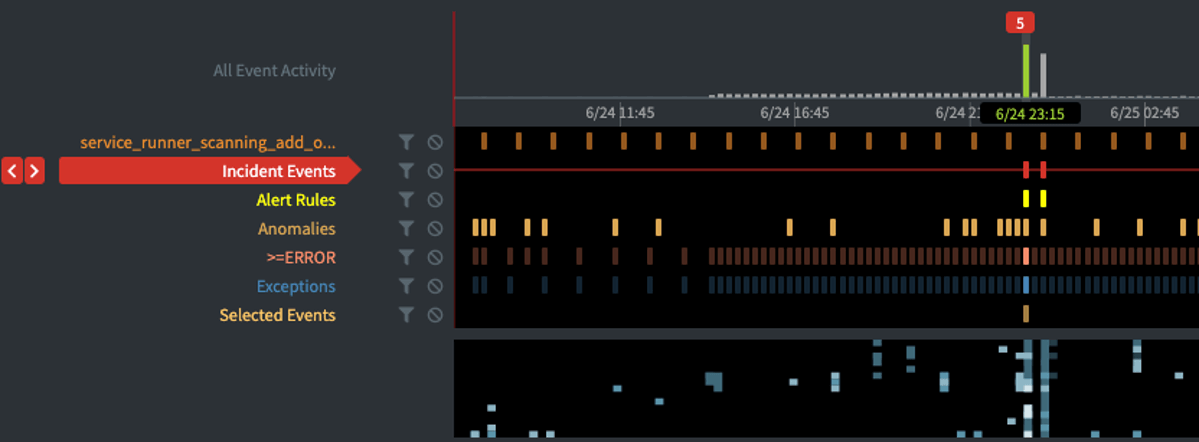 Fig 5: Anomaly Patterns Detected as Incidents in Zebrium
Once an incident is detected, the correlated log and metric anomalies are linked together into an incident which then alerts the end user to the issue.
The beauty of the step above is that the resultant collection of correlated anomalous log lines forms a narrative, containing root cause indicators (what caused the problem) and symptoms (what was impacted) of the problem. In order to build a root cause report, these are packaged together with any correlated anomalous metrics that have been detected.
The root cause report can be viewed in summary form: showing the services impacted, the “first” event (typically a root cause indicator) and the “worst” event (typically a symptom that a human would recognize as being a problem).
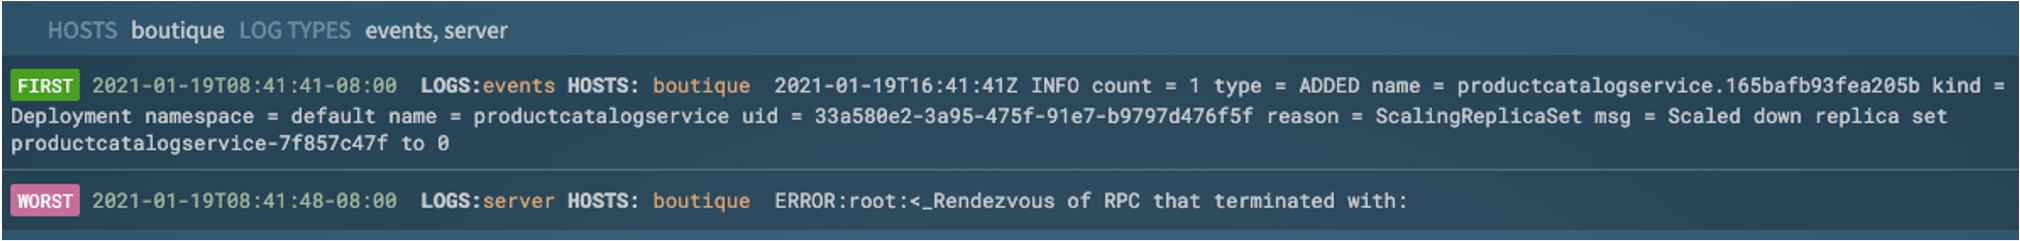 Fig 6a: Zebrium Summary Root Cause Report Details Page
A more detailed report, accessible with a click, displays the full sequence of log events and metrics:
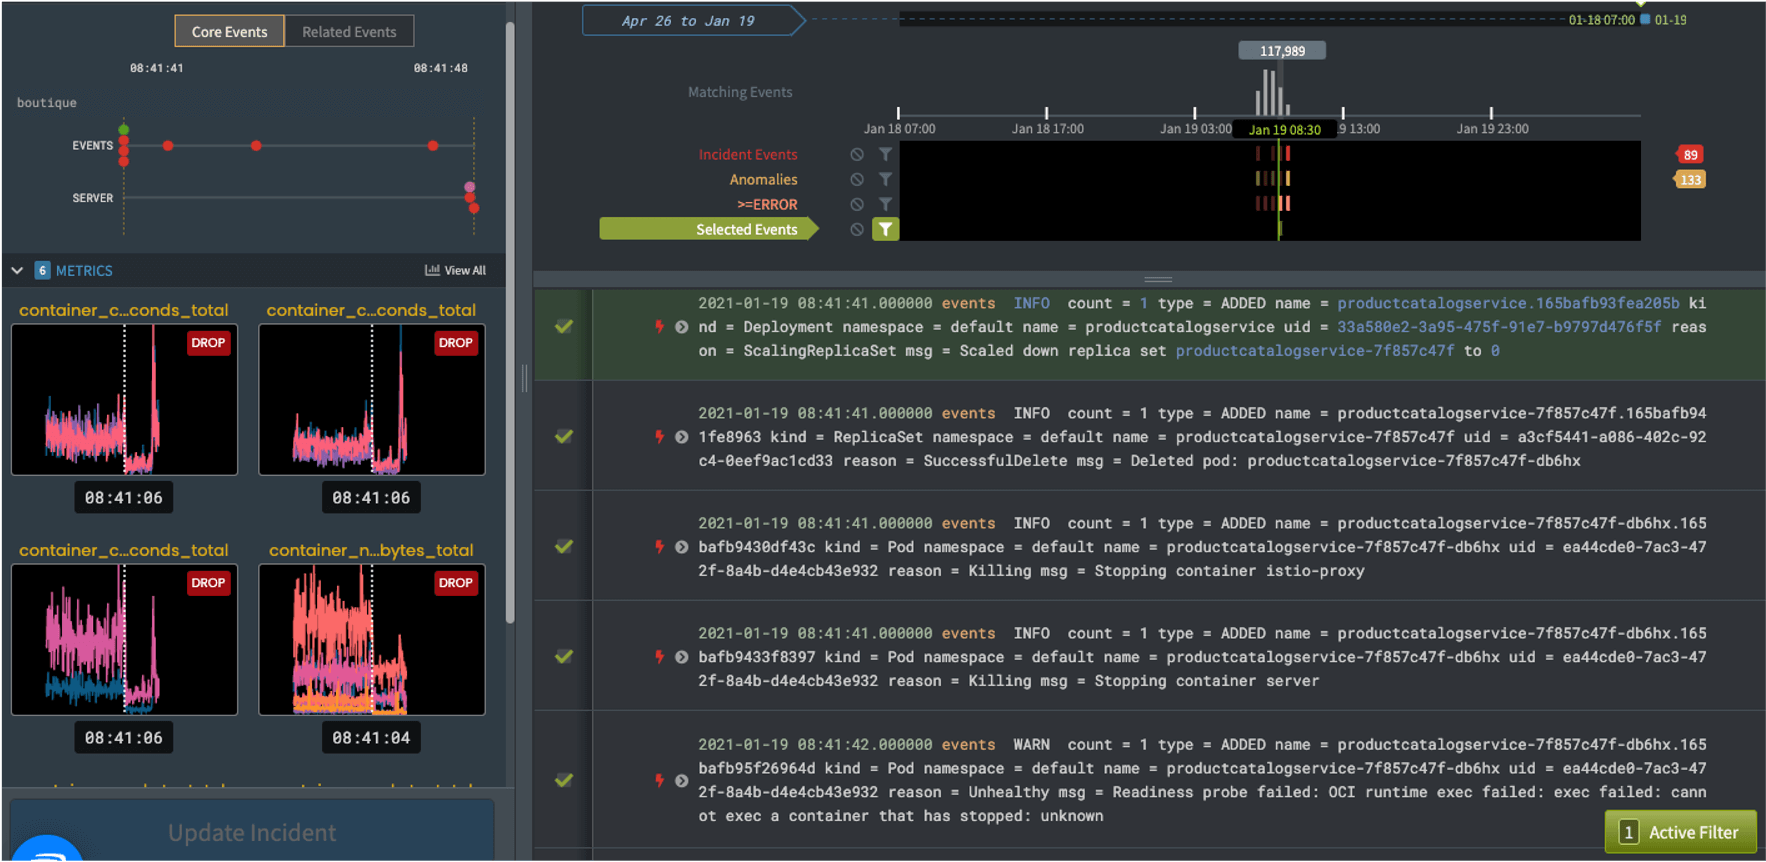 Fig 6b: Zebrium Detailed Root Cause Report
Initially the “core” set of log lines are shown – which usually provides enough detail to ascertain the root cause. If additional detail is required, the user is presented with an option to include nearby related anomalies and errors. A user can also easily drill-down on any event to see it in context of surrounding events.
The net result is that, without requiring manual “hunting”, Zebrium’s machine learning provides an effective way of automatically uncovering the root cause of a problem and delivering it to a user in a way that is easy to understand.
A user is also able to rate the quality of the incident and the behavior to take if additional similar incidents are detected in the future.
The root cause report generated in step 5 is understandable by a user who is familiar with technical log files. However, there is benefit in also producing a summary that can by understood by a less technical user.
Since the root cause report contains a very concise set of log events, these can be processed by OpenAI’s GPT-3 language model to produce a plain language summary of the problem. Using the example shown in Figure 6 above, the resultant summary looks like this:

Zebrium’s approach has been used to identify the root cause of more than 5,000 incidents, spanning hundreds of custom, open source and commercial application and infrastructure stacks (see examples here). It has proven to be highly accurate at finding root cause indicators without manual hunting, saving an average of three hours per critical incident.
Many organizations also use the technology to perform proactive detection of new/unknown failure modes. This provides an effective way for developers to improve product quality and proactively fix latent bugs, before they manifest as production P1 incidents.
Most importantly, the Zebrium approach works completely unsupervised and does not require large training data sets. Accurate detection and root cause identification typically occurs within the first day of use.
Conclusion
As the complexity of software systems and volume of logs and metrics continues to increase, it is inevitable that a machine learning solution will be required to detect incident patterns and find root causes. Without ML, users have to spend countless hours manually scanning charts and searching large volumes of logs for root causes during an incident. This inevitably leads to more downtime, slower MTTR, more customer churn and ultimately revenue loss.
This paper reviewed why applying ML to logs and metrics is hard, and why existing approaches have failed to effectively detect real-life incidents and find root cause at scale. It also demonstrated how Zebrium’s novel approach to the problem enables it to achieve a very high accuracy rate without needing human supervision or large training data sets.
Today, the Zebrium platform is relied upon by enterprise customers around the world who use Zebrium to slash resolution times when incidents occur. It is also available for any user to try for free. The incident and root cause detection accuracy of our ML models is continually improving, enabling our vision of a world where root cause is automatically surfaced. We encourage you to try it for yourself by signing-up for free here. Getting started takes less than two minutes.
![]()
![]()