
At Zebrium, we have a saying: “Structure First”. We talk a lot about structuring because it allows us to do amazing things with log data. But most people don’t know what we mean when we say the “structure”, or why it is a necessity for accurate log anomaly detection.
Our Vision of Log Anomaly Detection Software Using AI
A few years ago I had a vision: If Machine Learning (ML) could structure logs into a database as well as a human could, plus do this inline with log streams and keep the schema updated, you would have an amazing platform for building anomaly detection on top of logs. A clean distillation of log structure would represent the "dictionary" of unique event types generated by an application stack. And this in turn would allow machine learning to learn the normal patterns of these structured log events, and automatically detect abrupt changes in software behavior (log anomalies). The better the structuring and understanding of the event dictionary, the less noisy the resulting anomaly detection would be.
The goal for Zebrium is simple: Automatically detect software problems and their root cause by using ML to understand what’s happening in logs. And the foundation of this is being able to accurately structure the logs. Let’s walk through an explanation of how our unsupervised, inline machine learning engine structures the data.
Structure First: Our Approach to Log Analysis with Machine Learning
A simple example: here's a log snippet.
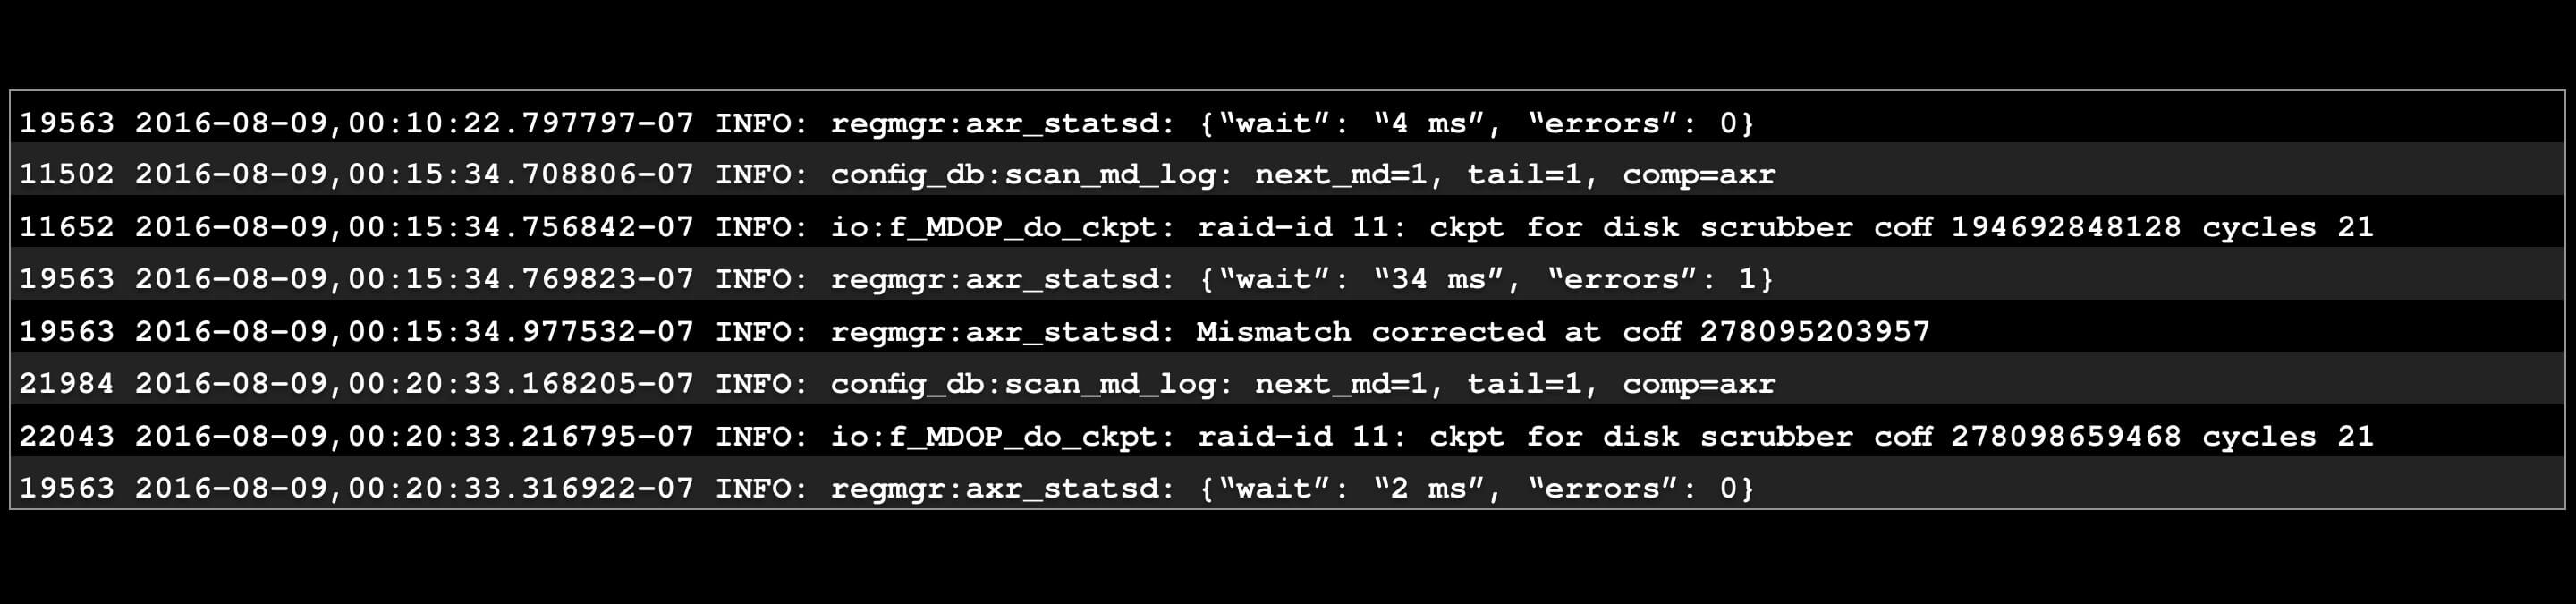
The mind structures: there appear to be 4 different “things” here.

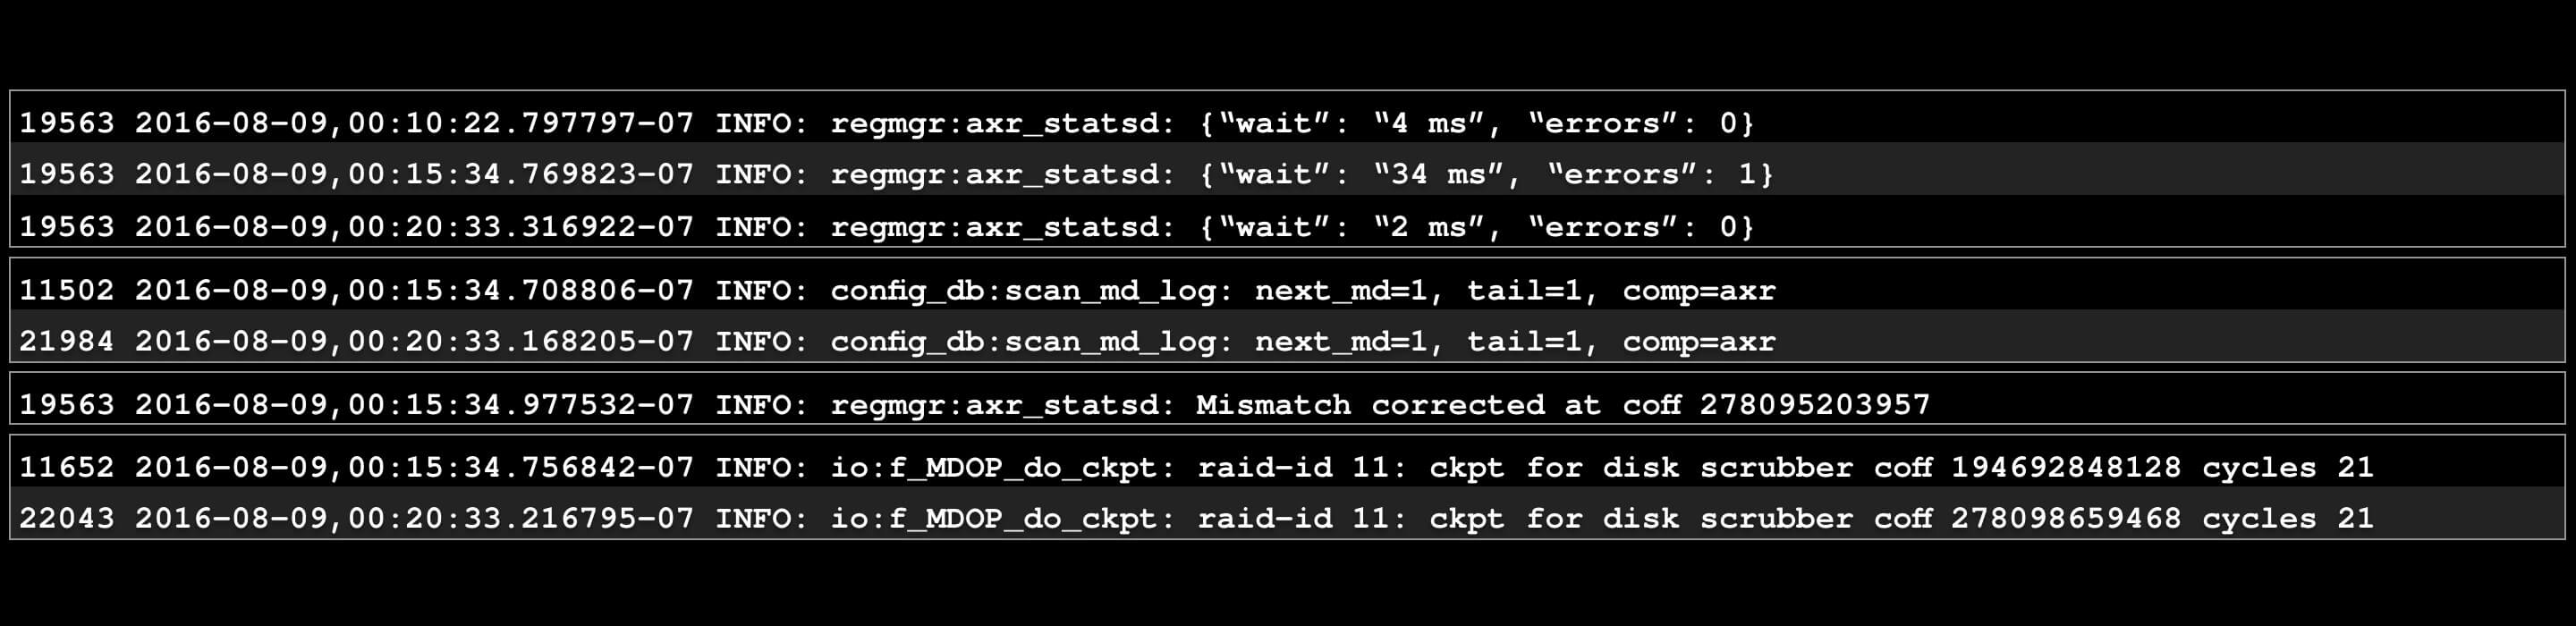
Rearranged: it’s more clear this way.
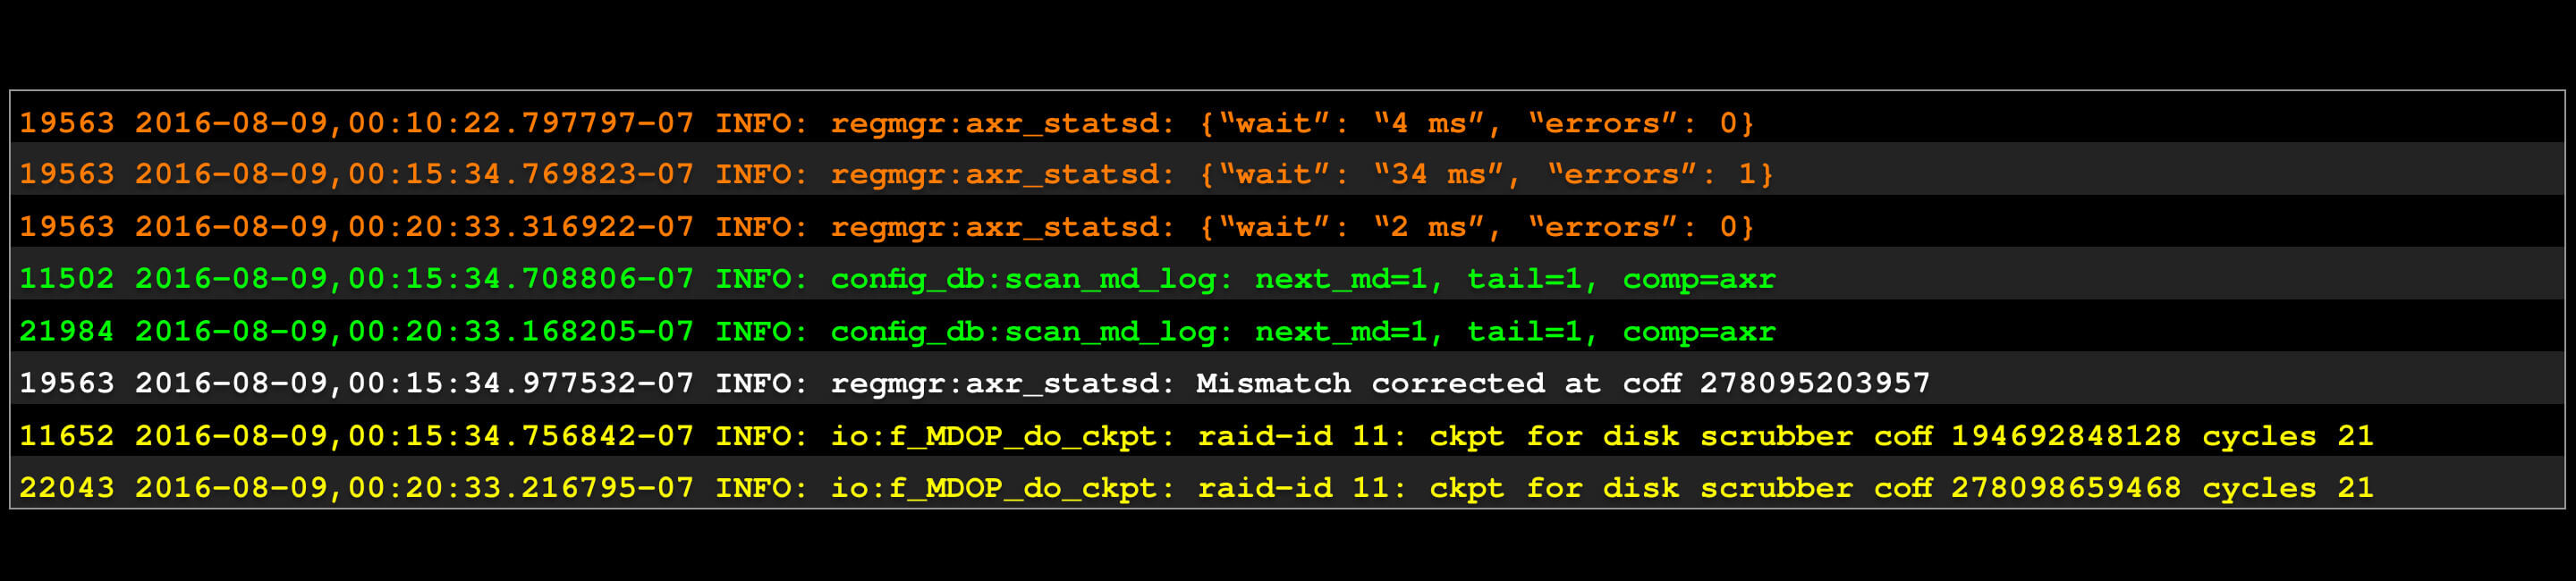
Even better: we call these 4 chunks etypes (short for “event types”).
The Anatomy of a Log Line
The prefix of a log line usually contains a timestamp, a severity and such things as a process name and PID. It’s typical for log management software to keep a pre-defined list of well-known prefix formats, and require you to create parsing expressions for other custom ones. We don’t do that. Instead, we automatically learn the prefixes associated with a log file or stream ourselves. We’ll try to guess at good names for them too, but you can always override them.
The body of the log (which contains the meat of the event, often a string of text and variables) is often left unstructured by a log manager. Or a user needs to define a parsing expression for each variant. Once again, we use machine learning to structure the contents of a log line too.
Event Types Let Us Learn Patterns and Perform Log File Anomaly Detection
Determining the etype (“event type”) is the more exciting part. Etypes are made up of a name, structure, and evars (“event variables”). We learn the evar names and types from the body of the event and the prefix.
Let’s demonstrate this by stepping through the above four chunks of log text, one etype at a time:
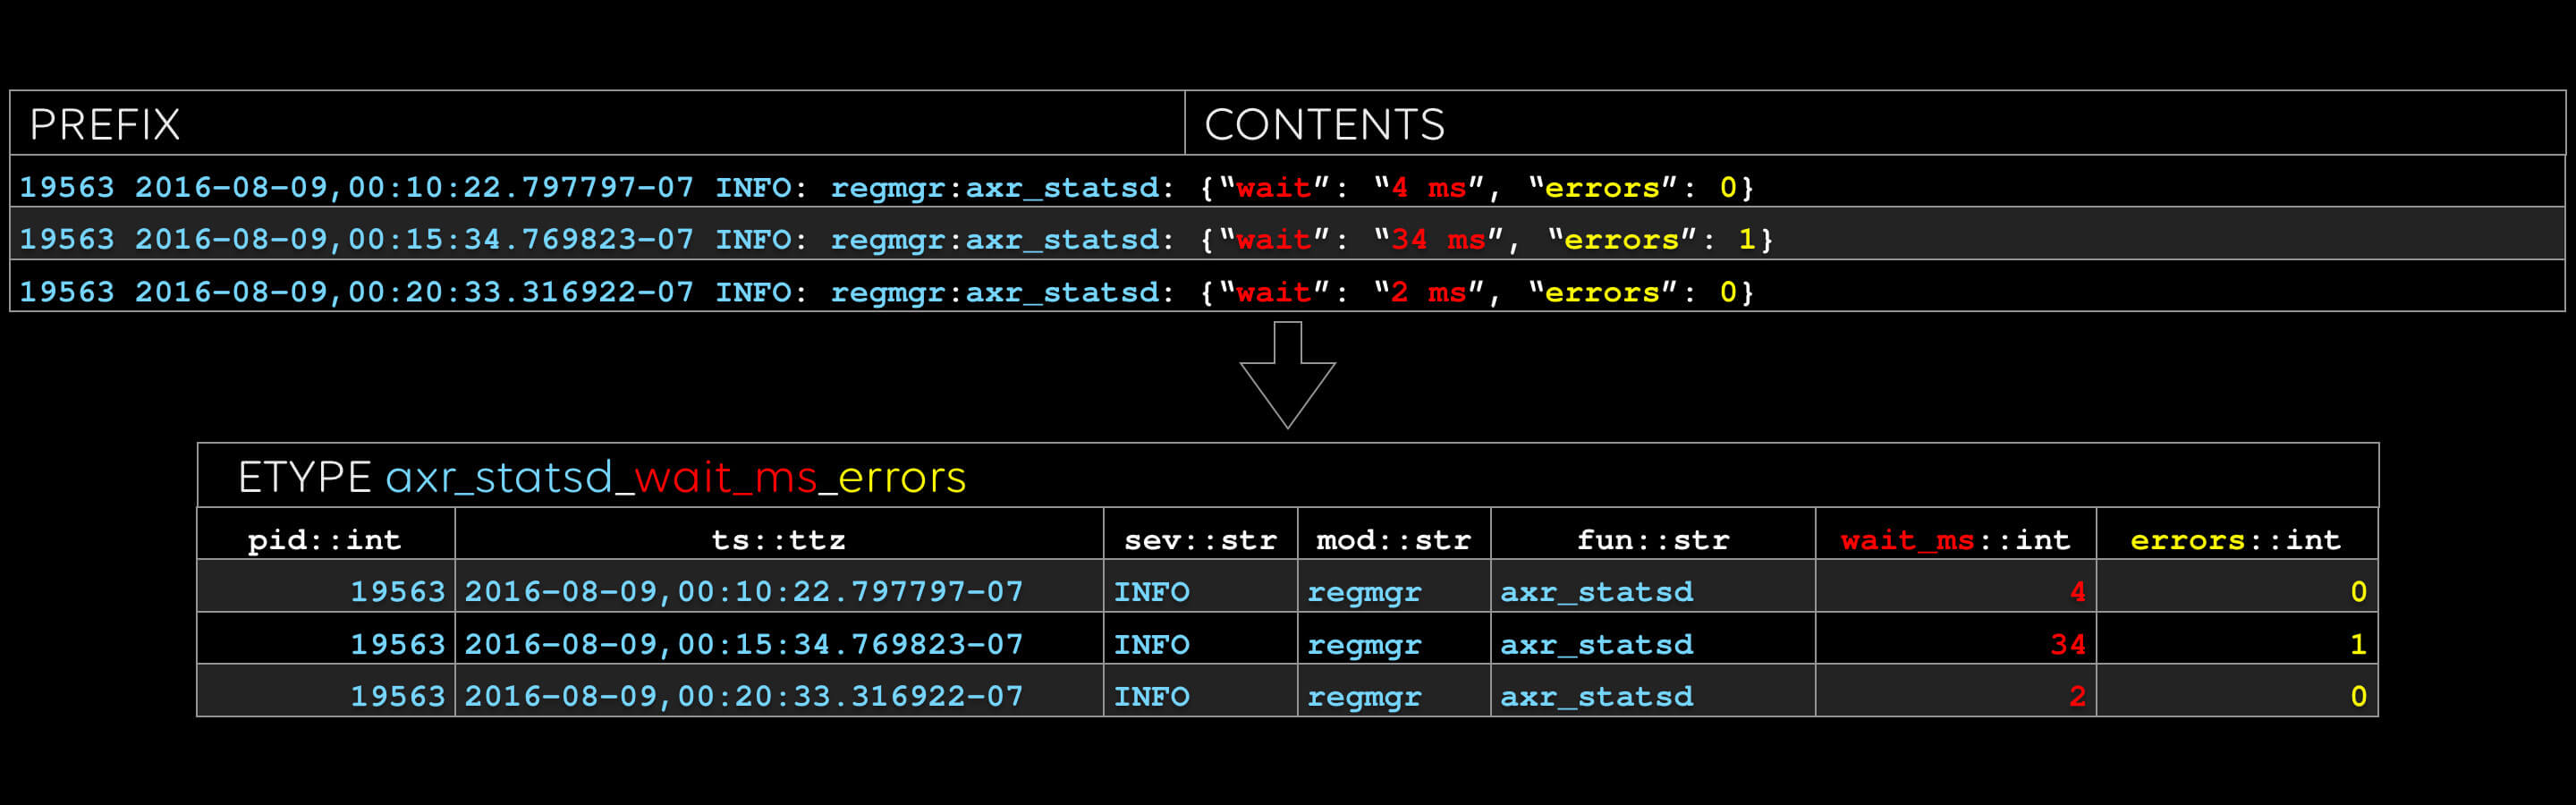
The first etype:
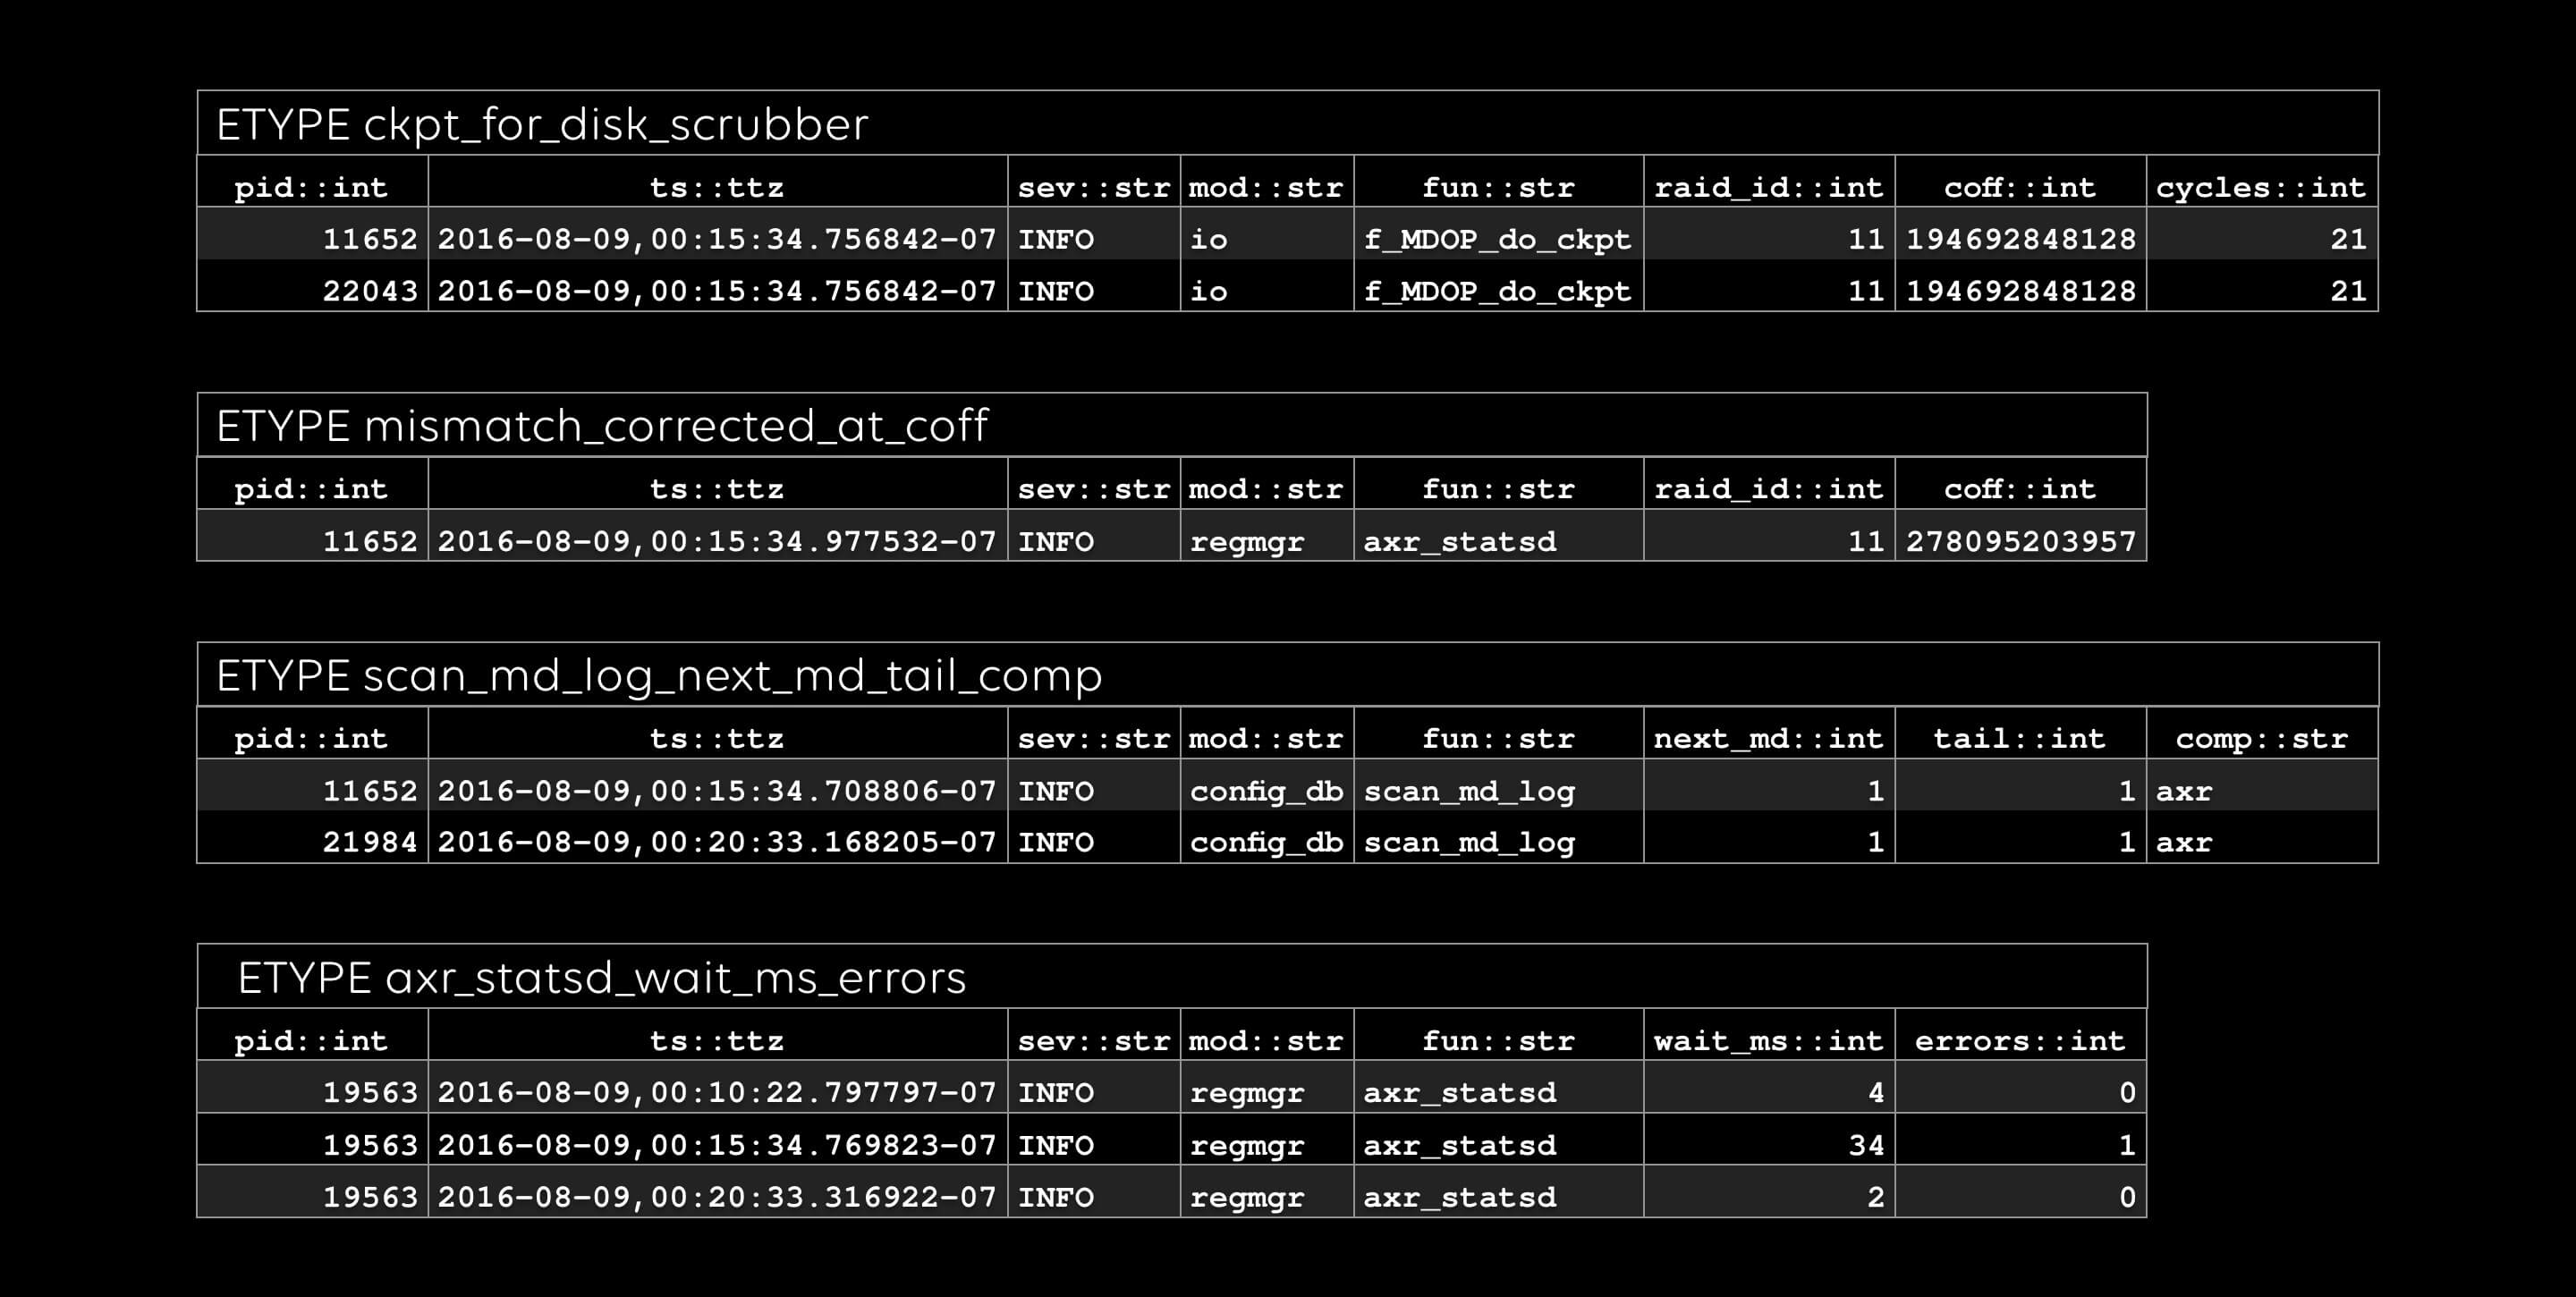
The name of the etype "axr_statsd_wait_ms_errors", is derived from the fixed text in the log line. Look at those yummy stats in the two rightmost columns. One flavor of anomaly detection is looking for features in timeseries like these. We call the columns, such as “fun” and “wait_ms”, evars.
With this level of structure, you know for sure that every number in a time series really is the same evar, associated with the same etype. In a future article, we’ll show how we automatically extract dimensions of timeseries metrics and detect anomalies in them.
The second etype: note that we give a type to every evar.
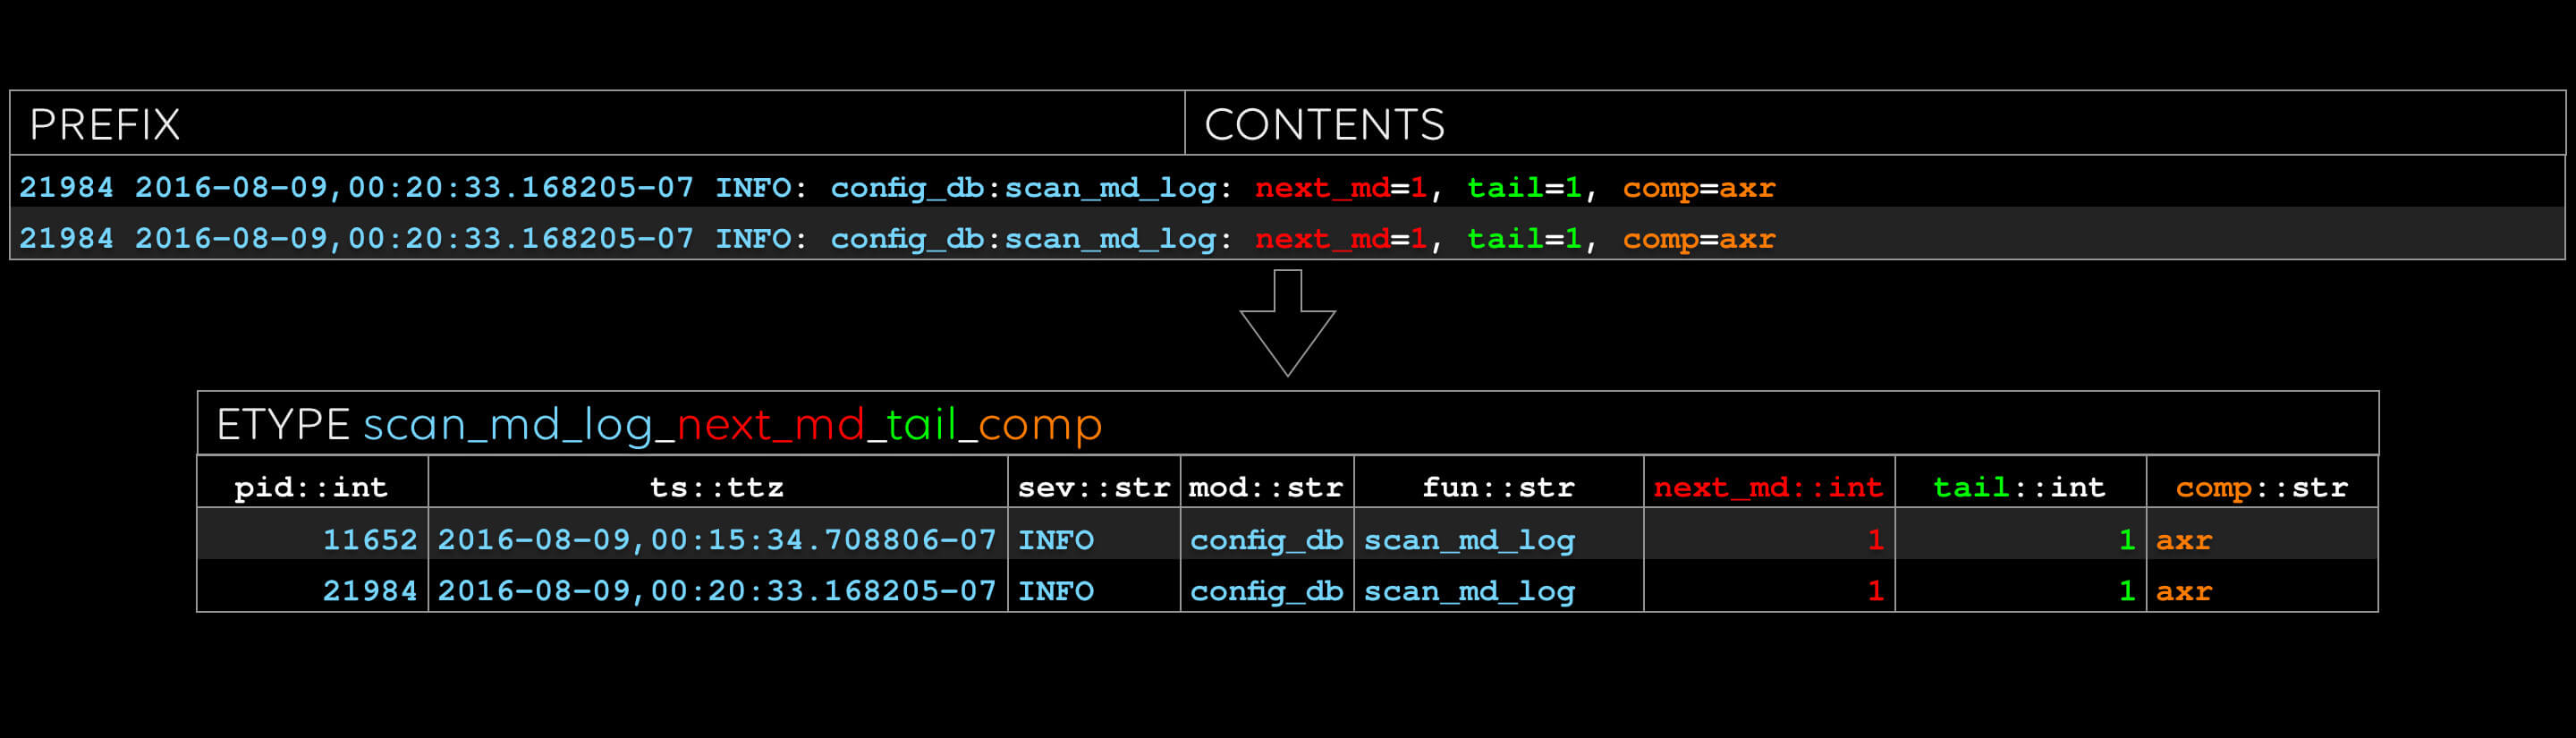
We have notions of simple types such as “float” and “str”, as well as complex types such as file paths and MAC addresses. We plan to allow users to add more.
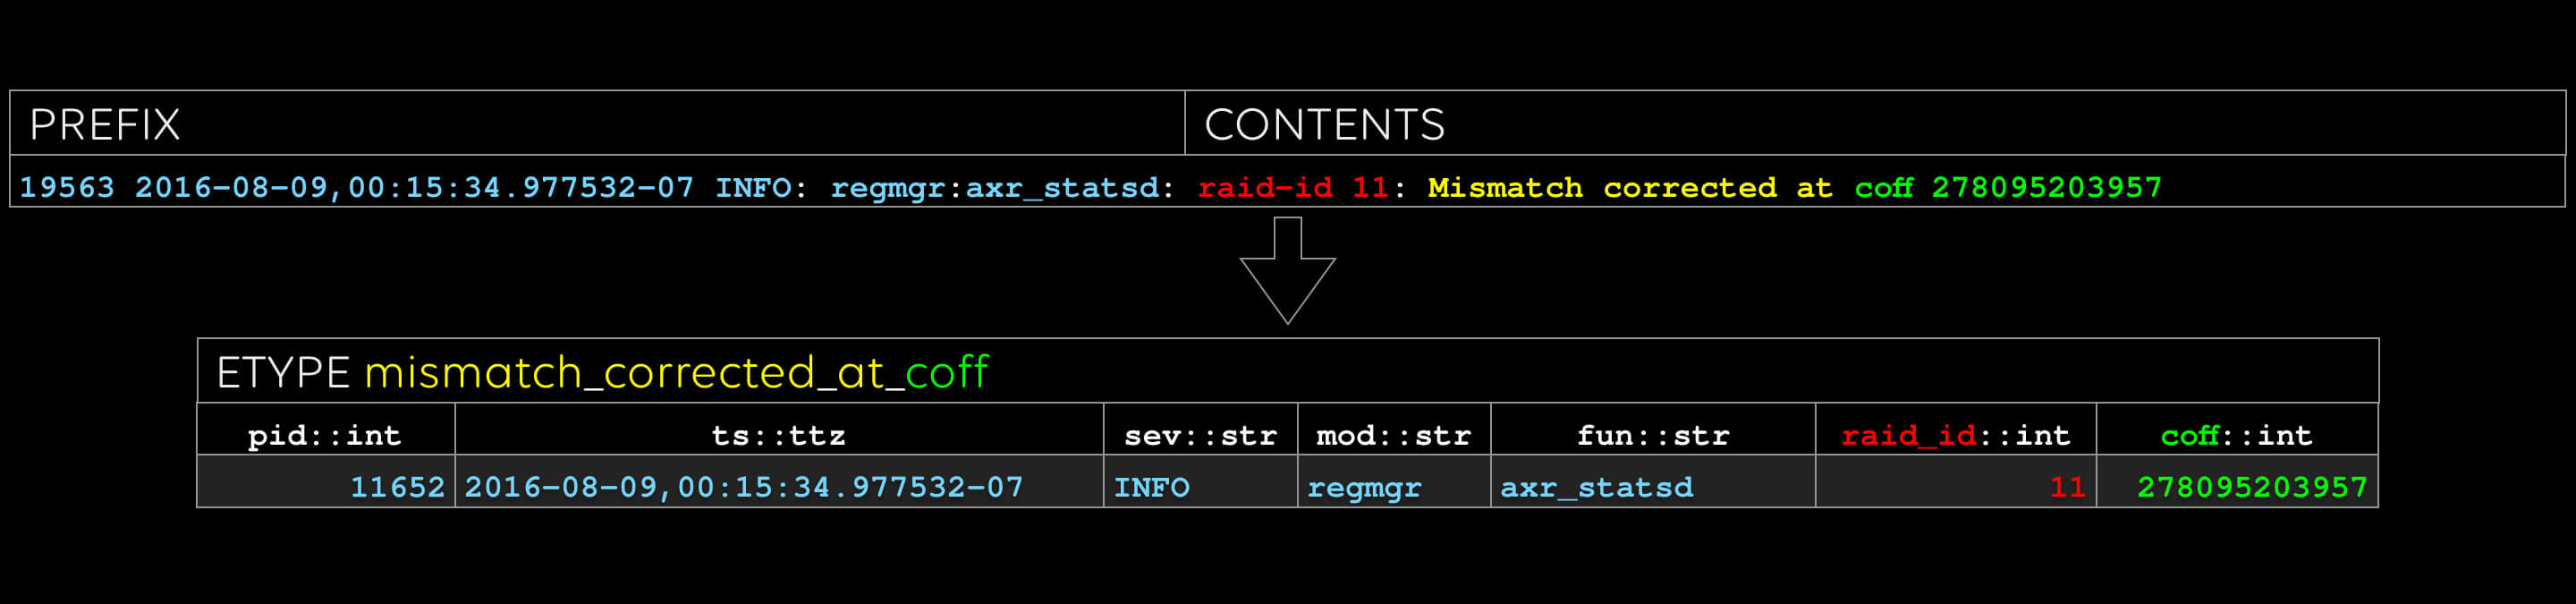
The third etype: sometimes there are good cues for what to name the evar, like “coff” in this case.
Last one: note that “raid_id” and “coff” occurred in the previous etype, too. We can do efficient inner and outer joins on these columns, treating etypes like tables, if we like.
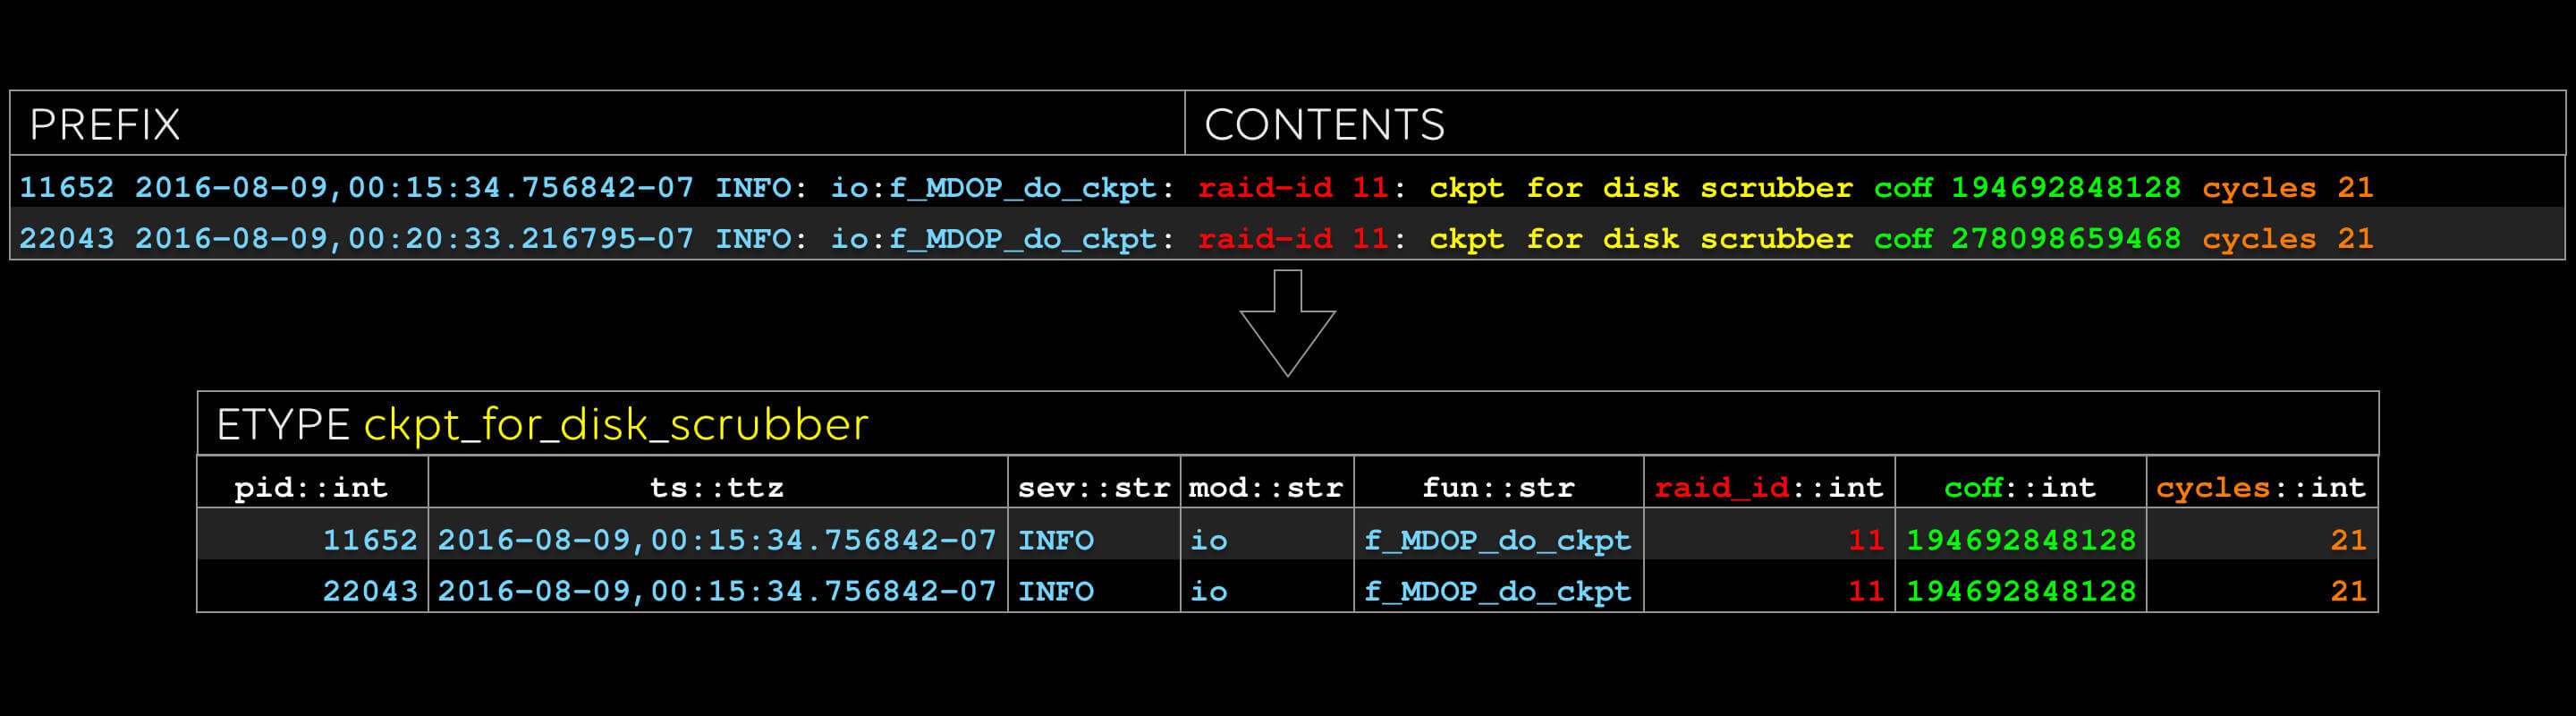
All done: conceptually, an etype is a table, and an evar is a column.
Log Anomalies From a Sequence of Etype Occurrences
Another type of anomaly detection relates to the sequence of etype occurences; a future article will go into more detail on our anomaly detection analytics. As a super-simple example, though, each etype will happen for the first time exactly once – and that’s clearly an anomaly of some kind, right? In fact, rare and new etypes tend to be hugely meaningful when trying to root cause a software problem. Let’s find out.
We run an Atlassian server. As part of testing, one of our engineers decided to log in and shut down the database behind the Atlassian applications. We then collected all the logs for the previous 19 hours or so to test automatic root cause analysis.
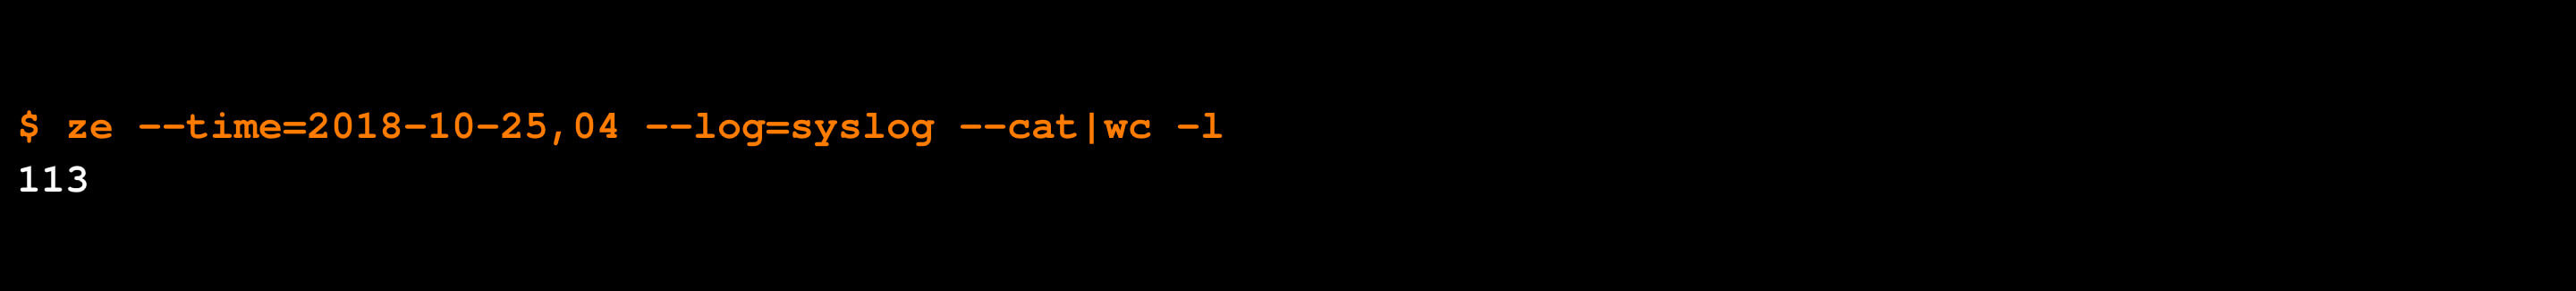
During the hour of the test, the syslog generated 113 events (many thousand more events were generated by the other componets):
Our internal API client: query and upload data from the CLI: CSV, JSON, or pretty-print.
Only two of those events were of etypes that had not been seen before:
Simple Example of ML log anomaly detection: if something happens for the first time, it is probably diagnostic.

Look at that, this type of AI anomaly detection found the relevant two lines that describe root cause, simply because the etypes were new! It turns out that this works surprisingly well for a very large variety of software incidents.
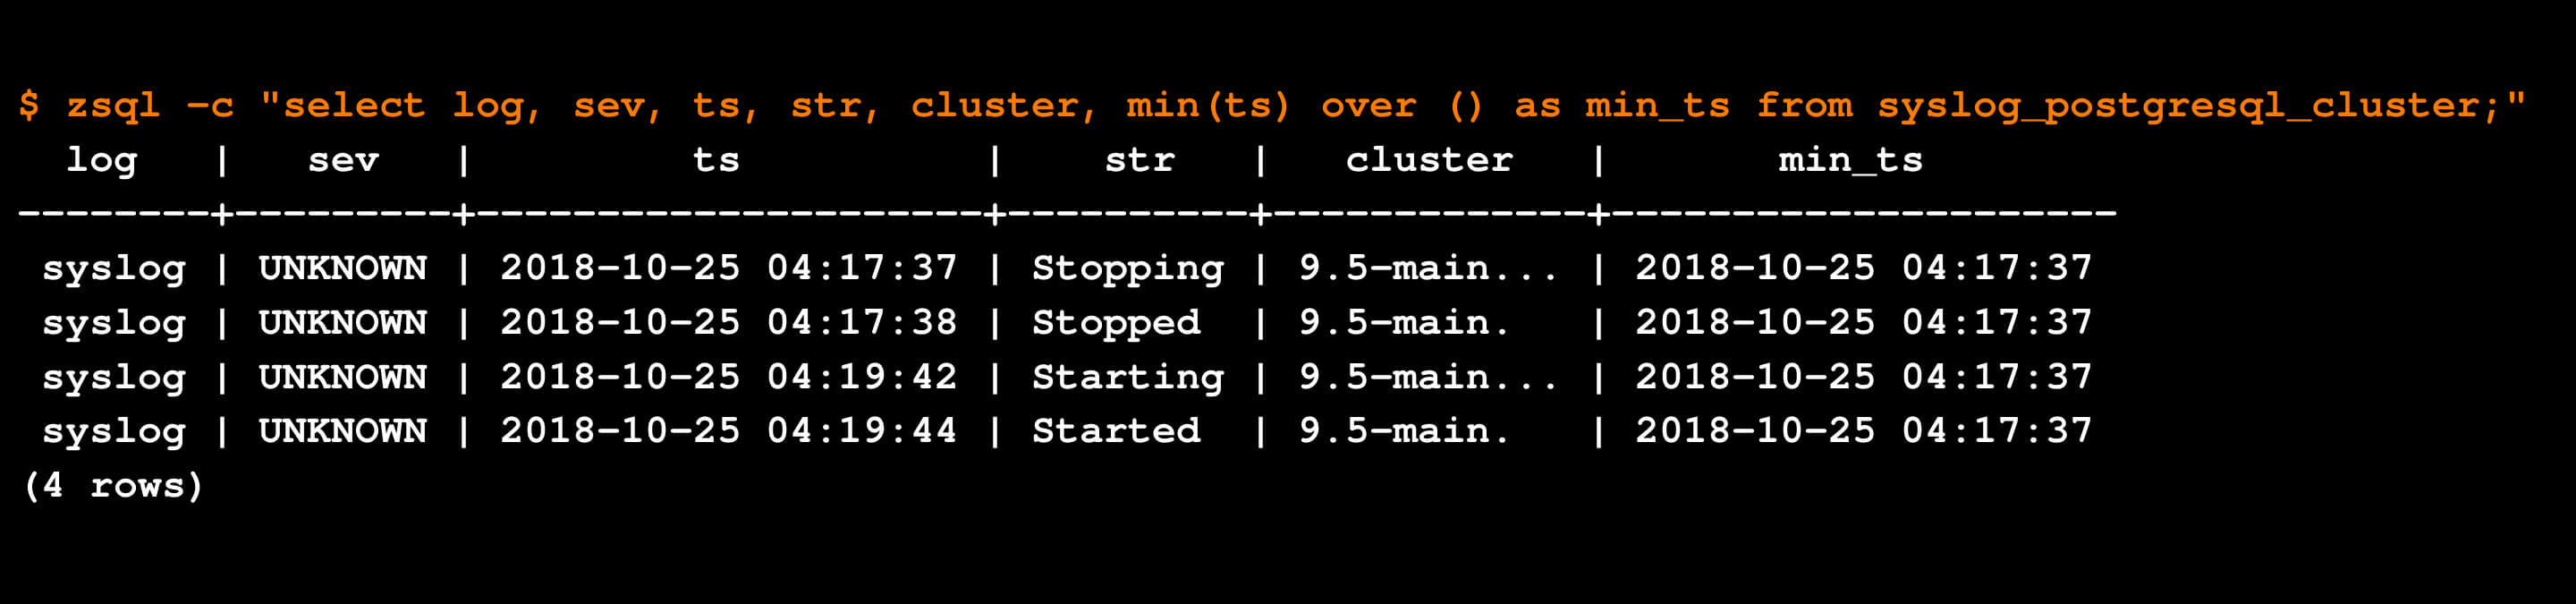
As an aside, it's interesting to look at all the data for one of our anomalous etypes showing the timestamp of its first occurrence (you can see how the values of the evar "str" change across the occurrences):
Automatic Log Anomaly Detection in Real Life
The examples above show how etypes and evars provide all the basic building blocks needed for log anomaly detection (or analytics of any kind on log data). The underlying foundation is to use machine learning to accurately structure the log data and build a dictionary of event types (etypes). However, in real life, highly effective unsupervised log anomaly detection on its own is not enough. This is because logs are extremely noisy, and uncovering anomalies still requires human interpretation.
Making Log Anomalies Highly Useful: Root Cause Reports
As mentioned above, our goal is to automatically detect software problems and their root cause by using ML to analyze logs. In order to do this, we take a multi-layered approach to machine learning on logs.
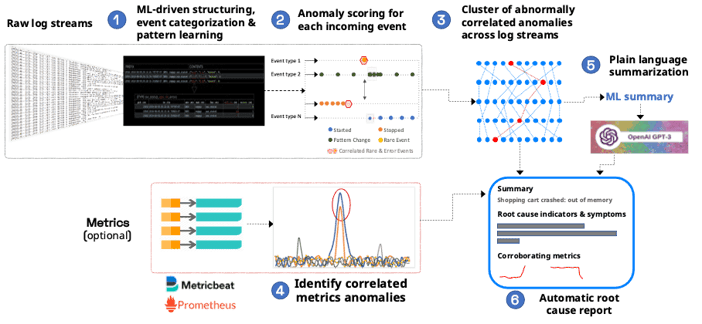
The key step that uncovers the "signal" from the noise of anomalies is to find correlated clusters of anomalies that span log streams. This technique produces useful root cause reports that are made of log lines that contain root cause indicators and details of symptoms. For more information on how this works, see here.
Since the machine learning is unsupervised, all that is required is the installation of a log collector (or if you use the Elastic Stack, just install a Logstash output plugin). The technology works with any kind of application or infrastructure and is particularly useful in distributed Kubernetes environments which can be hard to troubleshoot with traditional tools.

You can read more about it here or you can try it for yourself by signing-up for a free account.
FAQ
Popular questions about using machine learning to detect anomalies in log streams and log files.
How do you find log anomalies with machine learning (ML)?
Logs can be extremely noisy and are mostly unstructured. This makes anomaly detection of log data challenging. The fundamental requirement for accurate log anomaly detection is to be able to effectively structure log events and categorize them into unique event types. The technique used by Zebrium performs log structuring and categorization using unsupervised machine learning. Once categorized, Zebrium takes a multi-layered approach to anomaly and incident detection.
What are the best log anomaly detection tools?
The best log anomaly detection tools make use of log structuring and event categorization in order to improve the accuracy of log anomaly detection. Open source solutions such as the Elastic Stack (and its many derivatives) use LCS techniques for event categorization. Zebrium, uses a multi-layered unsupervised machine learning technique that tends to achieve much better results, especially for rare event types (rare event types are often very high value for log anomaly detection).
How do you use Machine learning for log anomaly detection in Kubernetes?
Kubernetes deployed apps can have complex failure modes that are hard to troubleshoot. To make matters worse, the volume of logs from every instance of every microservice can be huge. In order to perform log anomaly detection, you require a platform that is able to take raw logs from Kubernetes infrastructure and deployed apps, and use machine learning to automatically uncover anomalous log events. One such platform that is optimized for Kubernetes environments is Zebrium. For more information, see https://www.zebrium.com/product/kubernetes.
