We're thrilled to announce that Zebrium has been acquired by ScienceLogic!

Learn More

Machine Learning for Logs

ML for Logs Automatically Shows you the Root Cause

Zebrium - how it works-1

Logs and Metrics go In, Incidents and Root Cause Come Outfour simple steps-3

Step 1 - Ingest and Categorization

Install our Fluentd log and our optional Prometheus metrics collector, or fork a copy of your logs using Logstash.  No parsers, code changes, rules or config are needed. Then let our Machine Learning (ML) take over!

Within minutes, our ML learns the structures of your logs,  and categorizes each event into a “dictionary” of unique event types. Categorization is crucial for accurate pattern learning of your logs and metrics.

Log and metrics collector setup

Zebrium machine learning

Step 2 - Pattern and Anomaly Detection

Within the first hour, the patterns of each type of log event and metric are learnt (and the learning continues to improve with more data). 

When the pattern of a log event or metric changes (e.g. change in periodicity or frequency, new/rare message starts, etc.), it is scored as to how "anomalous" it is, but these anomalies tend to be very noisy. In order to separate signal from noise, the ML then looks for hotspots of abnormally correlated anomalies across the metrics and logs. 

Step 3 - Augment (optional)

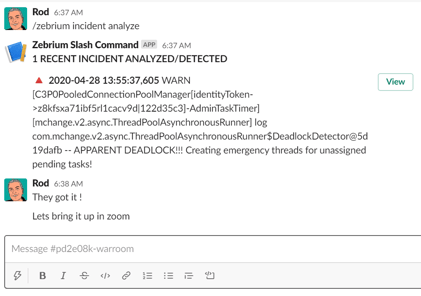
If you use an Incident Management tool like PagerDuty, Opsgenie or Slack, or an existing log management or monitoring tool, Zebrium can augment any incident with a characterization of root cause.

A signal is sent to Zebrium when an incident occurs. Or you can trigger a signal from the Zebrium UI. Zebrium then finds any root cause reports or sets of anomalous log/metric patterns that coincide with the signal, and automatically feeds the information back to your incident management tool.

Read more here: You've Nailed Incident detection, what about Incident Resolution.


PagerDuty with Zebrium to augment incidents with root cause


2 - Zebrium Autonomous Incident

Step 4 - Root cause reports

The hotspots detected above are packaged into concise root cause reports that contain root cause indicators, symptoms and correlated anomalous metrics. 

A plain language summary of the report is also created using OpenAI's GPT-3 language model (this feature is currently in beta - read about it here). 

The entire process is completely autonomous - without requiring manual configuration,  training or large data sets.

Getting started is free and easy

Spend just two minutes of your time and you'll be amazed at what we detect!

FREE SIGN-UP