
If you're reading this, you probably care a lot about Mean Time To Detect (MTTD) and Mean Time To Resolve (MTTR). You're also no doubt familiar with monitoring, incident response, war rooms and the like. Who of us hasn't been ripped out of bed or torn away from family or friends at the most inopportune times? I know firsthand from running world-class support and SRE organizations that it all boils down to two simple things: 1) all software systems have bugs and 2) It's all about how you respond. While some customers may be sympathetic to #1, without exception, all of them still expect early detection, acknowledgement of the issue and near-immediate resolution. Oh, and it better not ever happen again!
Fast MTTD. Check!
PagerDuty is clearly a leader in Incident Response and on-call Escalation Management. There are over 300 integrations for PagerDuty to analyze digital signals from virtually any software-enabled system to detect and pinpoint issues across your ecosystem. When an Incident is created through one of these monitoring integrations, say an APM tool, PagerDuty will mobilize the right team in seconds (read: this is when you get the "page" during your daughter's 5th birthday party). Fast MTTD. Check!
But what about MTTR? By R, I mean Resolve
All great incident response tools will have workflow and run book automation mechanisms that can help restore system operation quickly in some typical cases. But this doesn't get to the root cause so you can understand and resolve the issue and not let it happen again. For that, enter the all-too-common "War Room". That term and concept was first coined in 1901 but was probably made most famous by Winston Churchill during WWII where the Cabinet War Room was the epicenter of intelligence gathering, data analysis and communications throughout the war. Back then it was the telegraph, phones, radio signals and maps on the wall. Today it's likely a virtual room using Zoom, Slack, real-time visualizations, cell phones, and most important, logs. Millions and millions of logs! But, the prevailing attitude of the War Room has remained unchanged - "If you're going through hell, keep going".
The initial signal that triggered the incident was likely from an alert which perhaps detected that a predefined threshold was "out of tolerance" however simple or complex that may be. Or perhaps from an alert you defined in a ping-tool or maybe some home grown live tail watching for spikes in error counts or some similar patterns. Whatever the means, it was based on some predefined rule(s) to detect symptoms of a problem. In most cases, the next step is determining the root cause. For example, the symptom that triggered the signal might have been that latency was too high, but this tells you nothing about the root cause.
Whether you formalize a designated War Room for a particular incident or not, two things are certain: 1) timely, thorough and accurate communication between team members is paramount and 2) You’re likely going to search through logs and drill down on various metrics to get to the root cause. And this brute force searching through logs and metrics is probably your hell.
Stop going through Hell
Many monitoring tools have started to utilize various machine learning and anomaly detection techniques to raise that first signal to trigger an incident response, often via tools like PagerDuty. However, these techniques still require too much human input to handpick which metrics to monitor, and to choose specific algorithms or tuning parameters. Anomaly detection in monitoring tools is predominately geared towards time-series data and rarely for logs. Yet logs are indispensable for root case analysis. This makes these tools blind to the root cause of any issue and will ultimately require time consuming drill-down and hunting through the logs. Millions and millions of logs!
By contrast, Zebrium's machine learning detects correlated anomalies and patterns in both logs and metrics and uses them to automatically catch and characterize critical incidents and show you root cause (see - The Anomaly Detection You Actually Wanted. This means faster MTTR and no more hunting for root cause! We call this Incident Recognition and it's part of our Autonomous Monitoring platform.
Now, let me show you how you can tie your existing incident management workflow together with automatic root cause identification, regardless of the triggering signal – for fast incident resolution.
Augmenting detection with Zebrium automatic root cause identification
Zebrium uses unsupervised machine learning to automatically detect and correlate anomalies and patterns across both logs and metrics. These signals form the basis for automated Incident Detection and Root Cause identification.
In addition to autonomous monitoring, we can also consume external signals to inform our Incident Detection. Imagine any one of your monitoring tools in your PagerDuty ecosystem has created an Incident and you get "The Call" (at one of those inopportune moments). What happens? Well you probably already know the pain that will lie ahead. But what if instead you looked at the PagerDuty Incident and a full report of the anomalous logs and metrics surrounding the incident – including the root cause - was already there, at your fingertips.
Part 1 - If you use PagerDuty
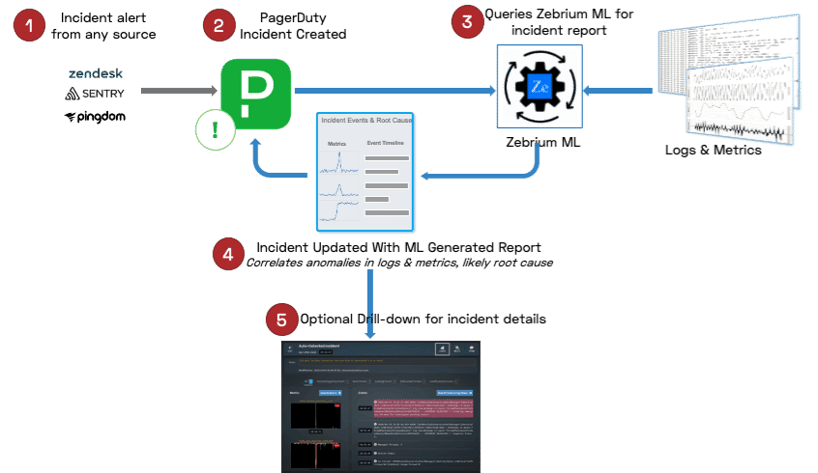
Here's how it works:
- Your monitoring tool raises an alarm
- Through an existing integration with PagerDuty, an incident is created and the escalation policy fires (the war room is now open)
- At that same instant, PagerDuty automatically calls an outbound webhook to Zebrium with all the incident details it has.
- Zebrium correlates those incident details with its Autonomous Incident Detection and Root Cause by looking across logs and metrics
- The PagerDuty incident is updated with Zebrium Incident details and likely root cause via the PagerDuty API
- If you need to drill down further, it's just one click from your PagerDuty Incident.
Part 2 - If you use Slack as your incident management workspace
Zebrium's Autonomous Monitoring platform can consume any external signal to inform and correlate incident detection and root cause. Let's say for example, you're working with colleagues and communicating in a Slack channel that has Zebrium's integration enabled in the workspace. Just type a command (or get your Bot to do it) to ask Zebrium for help and we'll pull together all the relevant anomalies, logs, metrics and provide near instant drill down capabilities to get you to resolution fast! All from Slack.
Here's how it works:
- You setup a slack channel for your Virtual War Room. You get the team together and you're looking at data from the APM tool and see some troubling stat
- You type "/zebrium incident analyze" to call on Zebrium for analysis and root cause
- Here it is... no more pain!
1 - The War Room
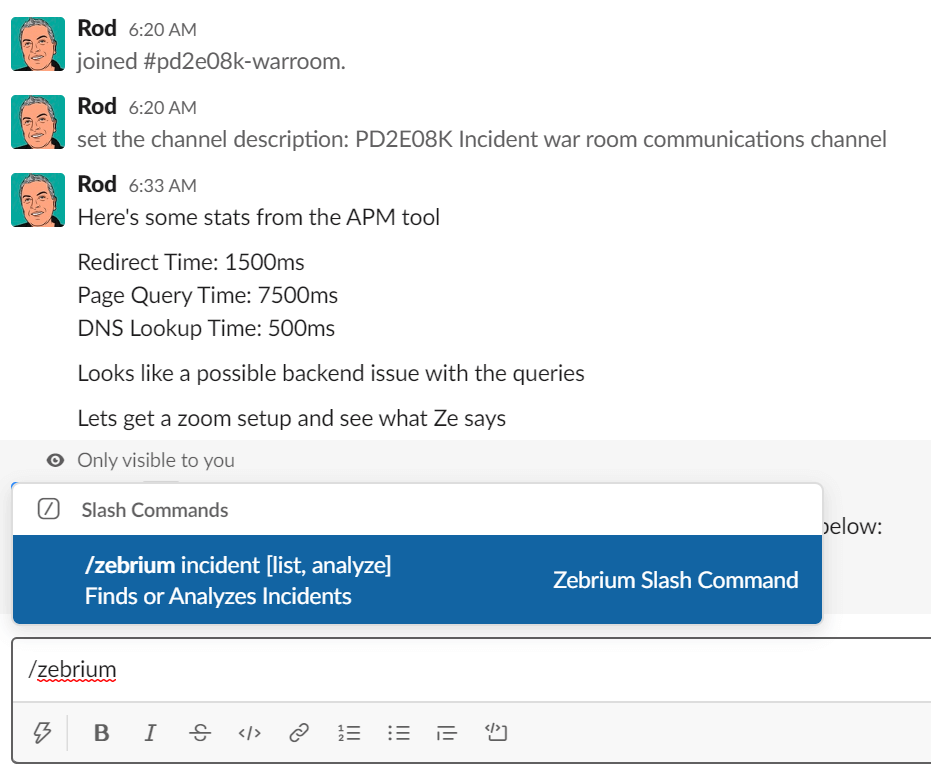 2 - Zebrium slash command in action (/zebrium incident analyze)
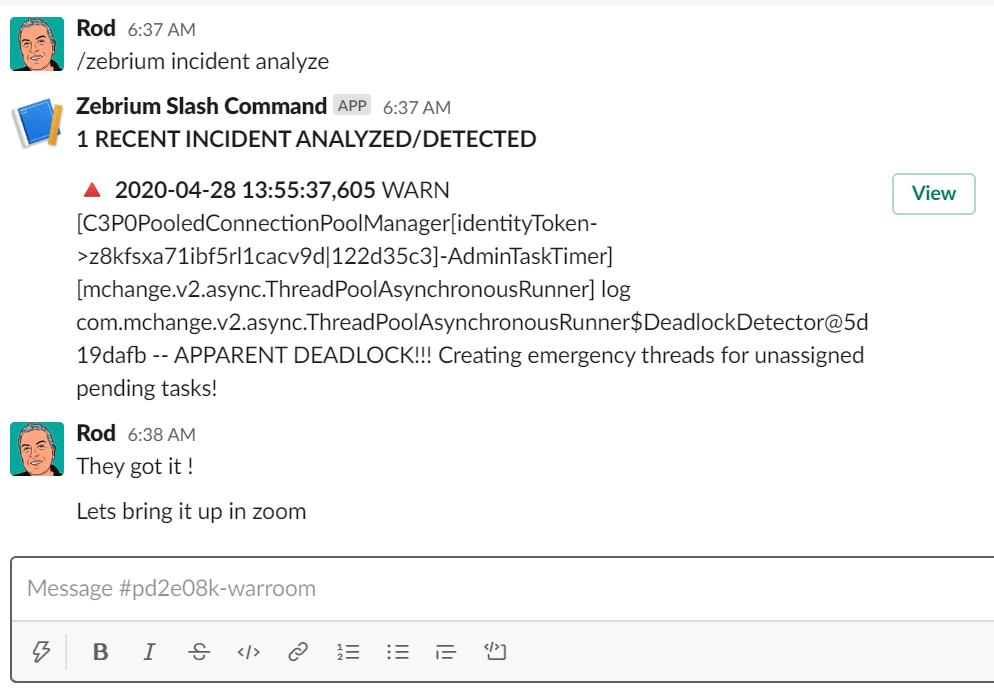 3 - Zebrium Incident UI showing root cause and correlated metrics anomalies

Let Zebrium take care of MTTR
Using the above integrations, you can now augment existing incidents that have been detected by any tool with Zebrium. In doing so, your incident will be automatically augmented with details of root cause without all the hunting, scrambling and adrenaline that is normally associated with a war room.
You can get started for free by visiting https://www.zebrium.com. Further details of PagerDuty and Slack incident augmentation will be coming soon.
Now that's MTTR!
