
Automatically Spot Critical Incidents and Show Me Root Cause
That's what I wanted from a tool when I first heard of anomaly detection. I wanted it to do this based only on the logs and metrics it ingests, and alert me right away, with all this context baked in.
Anomaly detection is generally NOT that. It's either noisy or it misses stuff. The anomalies themselves generally need to be examined in a broader context to see if they matter.
So when I say autonomous monitoring, I mean an observability platform that actually does the observing. I mean a monitoring tool that tells me what to look AT, without me telling it what to look FOR.
This is still what I want, and this is why Zebrium exists. I feel we have a version of this technology I’ve always wanted actually working, and so I want to share our work with you.
But, Why Go This Far at All?
Smart people can take a great observability platform and use it to help them monitor and root-cause issues. What always caused me headaches though, are the unknown unknowns... new problems where there won't be specific alert rules set up, and so the eyeball becomes the bottleneck to resolution.
Anomaly detection and great observability platforms can speed the resolution process. But as application complexity continues to grow, I feel we need autonomous monitoring. I'm interested in automating the eyeball itself: that is, putting together the bigger picture from all the different data points and clues. Getting it right means getting to root cause much faster than having to search around and do it by eye.
Autonomous Monitoring, in Practice
This is incredibly important to recognize: for big chunks of your stack, and for your own application, there will be no connectors or rules unless you build and maintain them all yourself.
Since we're interested in the unknown problems, and since an application is generally bespoke, autonomous monitoring can’t require the following sorts of things in order to start adding value:
(connectors, parsers, rules, alerts, training, configuration,
knowledgebases, regexes, logic, semantics, ...)
regarding:
(services, stacks, web servers, kernels, applications, dependencies,
databases, APIs, logs, metrics, ...)
It should require nothing more than the raw logs and metrics. I imagine it sounds too good to be true, that a monitoring system could function this way, but we’ve proven it works on dozens of applications and hundreds of real-world incidents. Since we can’t share details of real user’s incidents, instead I'll show you what's possible with four simple examples. I'll also explain for each what the software is picking up on, under the covers.
Example 1: Running Out of Space
Who hasn't had this happen before, seriously: some process or user starts over-consuming space, and things start breaking. This example is set in our dogfood deployment. It happens to have a database running on Google Cloud instances, and application services running in K8s. It's a pretty busy deployment, monitoring our production instance. This deployment differs from production in that the dogfood database is backed by Minio object storage, as opposed to S3.
Now, the application has access to a pool of fast local storage that it uses for various reasons. It's fast enough, actually, that it can be overwhelmed in a matter of a few seconds. At that point, lots of things can start breaking. So, our intrepid engineer Brady Zuo decided, why not copy a big file to it and see how we pick it up. Here's what that looks like, from the perspective of an incident alert created by autonomous monitoring:
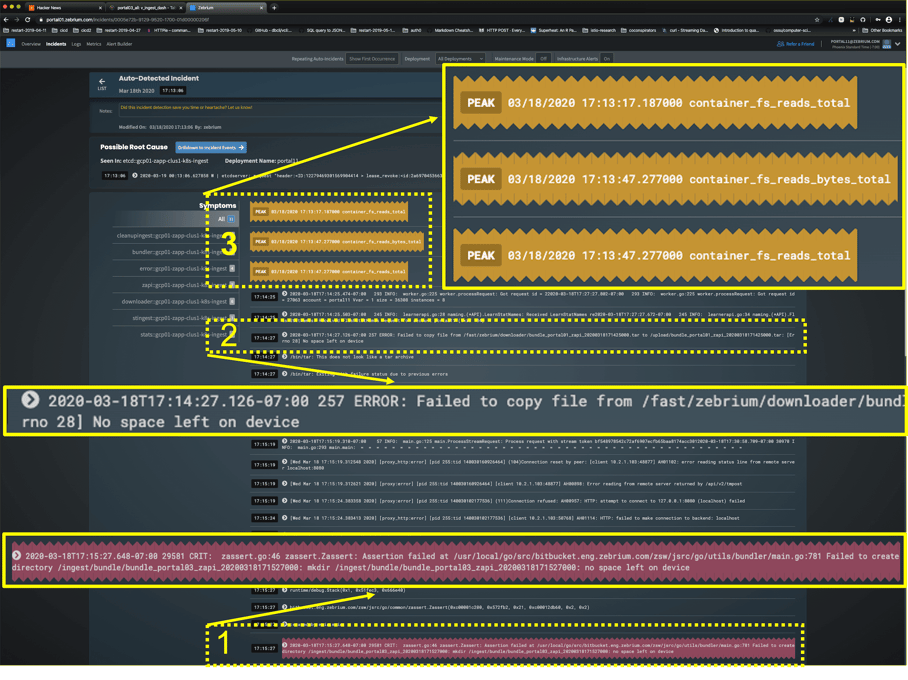
In this image, I have highlighted/enlarged a few things:
1) Why the user should care - one of the worst effects of the incident, inability to create a directory, from an ingest service error log. This is identified automatically.
2) A root-cause indicator - the failed copy from the bundler log is shown, giving us a hunch
3) Correlated metrics - some correlated metric features to corroborate our hunch from (2): a copy will read
I think a DevOps or SRE user could scan this report and be pretty sure about what had happened.
Why This is Awesome
Here’s why this incident alert is amazing: there is nothing in the monitoring software or configuration that knows anything about Minio, "copy", "space", "fs", etc. It doesn't need to because the telemetry itself has bits of this semantic knowledge built-in, in the form of readable logged events and meaningfully named metrics. The job of autonomous monitoring is to put these pieces together and report them to the user in Slack, as details of the incident are detected.
Let’s consider how a person might have put together the narrative around these pieces of data and discarded others, when working through the incident. In this case, the copy error is relatively rare (less than once/wk, say), so it is anomalous. Such a sharply-defined peak in reads is also relatively rare (less than once per hour, say). The effect of being unable to create a directory is also relatively rare (less than once/mo, say).
These are exactly the sorts of things a person would notice. Among other things, expertise means knowing what's unusual, and also what's bad. A person might then also conclude it is exceptionally unlikely that these rare things should happen so closely in time to one another, simply by chance, and so infer that these anomalies are all part of the same incident.
And that's exactly how autonomous monitoring works. If we track things like the "rareness" and severity of a particular type of log event - structuring the logs completely into event types, at ingest - we can start to build a system to do the same thing. And if we track metrics with an eye to anomalies and features, we can continue to expand the capabilities of the same system. In fact the more telemetry you give it, the better a job it can do. You can then go further by fleshing out more complete co-occurrence models, or by finding further anomalous log events based on parameter changes, and so on.
Example 2: Transient Object Store Disruption
Object stores are really convenient ways to coordinate MPP applications. Sometimes, though, there can be transient problems connecting to them, or disruptions to them, and these can cause service degradations. In this case, our intrepid Brady decides to throw a wrench into the works by stopping the Minio service for a bit. It's not enough to take down the database, but it does ripple through application services that talk to the database, in the form of timeouts and/or transaction failures.
Here's what the incident alert has to say about it:
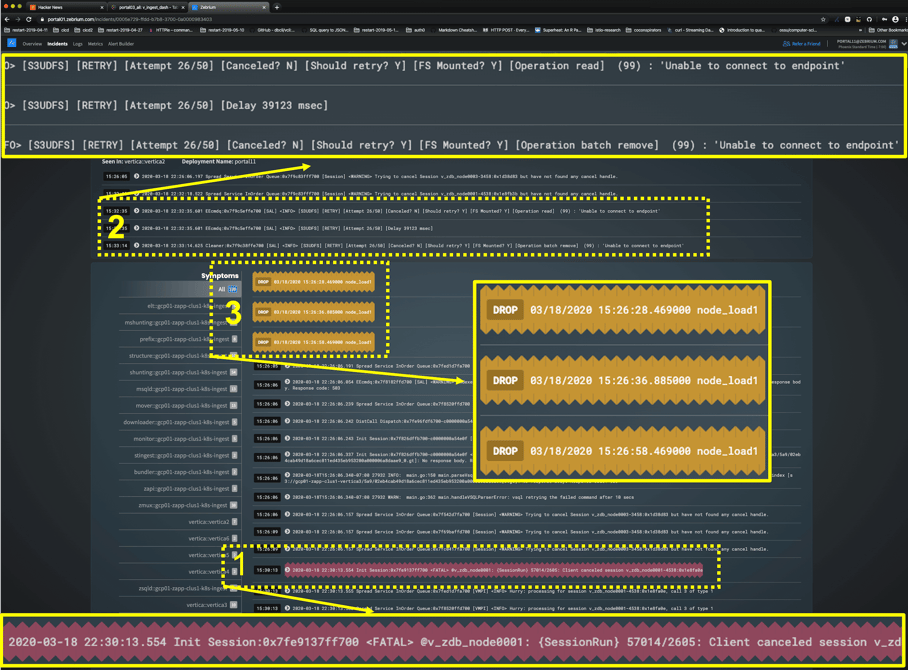
Again, I've highlighted a few things in the image:
1) Why the user should care - among the worst effects, here we see clients logging transactions being cancelled (again the red-highlight is auto-generated by the software)
2) A root-cause indicator - the database log complains that it can't connect to the object store
3) Correlated metrics - corroborates widespread effects; there's a lull in ingest AND query activity
Again, I think autonomous monitoring shines through here.
Example 3: Atlassian DB Shuts Down
What we're looking at here is still our dogfood instance, except since it's multi-tenant, it's not only monitoring our production environment, but our internal systems, as well, such as our Atlassian stack. This particular incident was created in the Atlassian deployment.
Now, it's true that for whatever reason, the database can be shut down, gracefully or otherwise, and all hell can break loose. I guess Brady was feeling brutal. But really, I like this example because the database shutdown is so clearly indicated at the top of the incident alert:
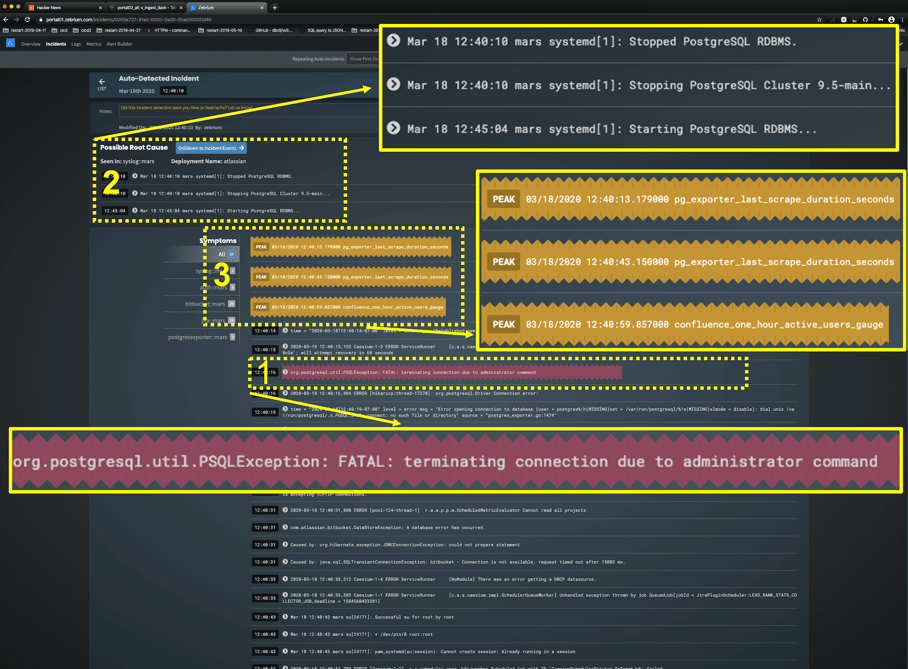
Again, I've highlighted a few things in the image:
1) Why the user should care - among the worst effects, we see bitbucket and jira go bonkers
2) A root-cause indicator - the database was clearly stopped by an administrator, from syslog and clients
3) Correlated metrics - it's hard to scrape postgres when it's down :)
Pretty clear, right?
Example 4: OOM Killer Invoked
For a quick last one, Brady decided to run the Atlassian stack out of memory. Here we have a Java process getting killed to reclaim memory. Here's the incident alert:
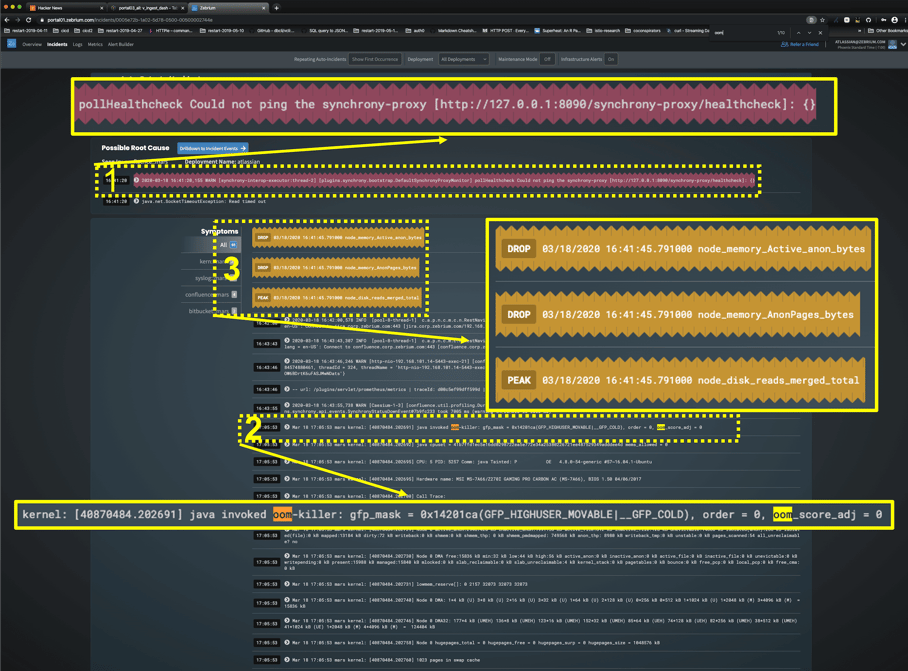
I've highlighted:
1) Why the user should care - services unavailable / timed out / unreachable
2) A root-cause indicator - you can see the little highlights on oom :)
3) Correlated metrics - the kill did indeed free up memory
Room for Improvement
One thing you'll in Example 1 is that the "root-cause" line at the top is not actually the root cause, but some related fallout. One of the ongoing improvements we’re making here is to better bracket these incident alerts. We've also removed the "Root Cause" title for now, since it's pretty clear that the first few lines will usually contain that, anyway.
And there's clear room for improvement in Example 3, as well. In particular, the software picked a few metric anomalies to show here but maybe not the best ones. And on the same topic, we've since also replaced the little yellow text ribbons with charts that let you drill down into the metrics for exploration.
Conclusion
If you've made it this far, thanks for reading along. Obviously there are many ways to tighten up these alerts, but conceptually I hope I've convinced you that the future of monitoring is autonomous.
Learn More or Try It For Yourself
If you're interested in trying autonomous monitoring for yourself, please visit our website to sign up. It's free to try and you can be up and running in less than 2 minutes. You can also find out more by downloading our whitepaper here.
