
Zebrium’s focus is to simplify the jobs of SREs, developers and support engineers who routinely troubleshoot problems using logs. Our unsupervised machine learning (ML) identifies the root cause of incidents and generates concise reports (typically between 5-20 log events) which spell out the timeline and details of the problem, including the first unusual event in the sequence (typically the root cause), the worst symptoms and other relevant events.
Distilling a problem down to just 20 relevant log lines is a big time-saver for engineers (vs hunting through millions or billions of log lines). However, in our quest to do even better, we wanted to find a may to make these 20 log lines more intuitive, especially if the engineer or SRE looking at them is not familiar with the application internals.
Timeline Visualization
All possible problem Root Cause Reports (RCRs) are now visualized in a concise timeline view, allowing an operator to quickly zoom into the time range of interest and pick out the most relevant root cause reports. This representation also highlights time ranges with more problems, quickly drawing eyes to hidden issues or areas of concern.

Richer Summaries
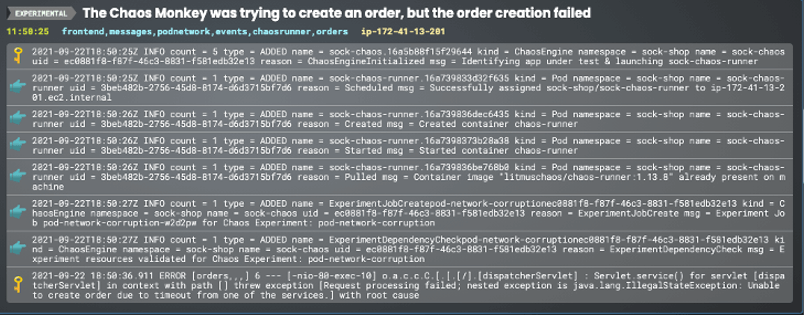
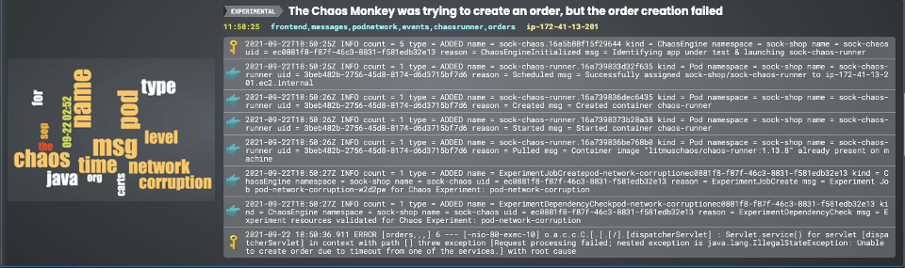
When scanning RCRs under time pressure, we wanted to provide the user with a richer summary of the problem so they could decide if the problem merited a deeper drill down. To accomplish this we added more “notable” events to the summary view - highlighting the most unusual (the rarest) log lines as well as the events with the highest severity in a short list (no more than 8 events in all). In the example below, a network corruption Chaos experiment caused the orders service in an online shopping app to fail. Our ML generated a summary view and automatically picked out the start of the chaos process, the start of the network corruption experiment, and the fallout in the form of an error from the orders service.
Plain Language Summaries
Perhaps the area of greatest focus for us has been finding ways to distil a collection of log lines into natural language summaries or keyword collections, which are easier for a user to scan and grok than raw log lines.
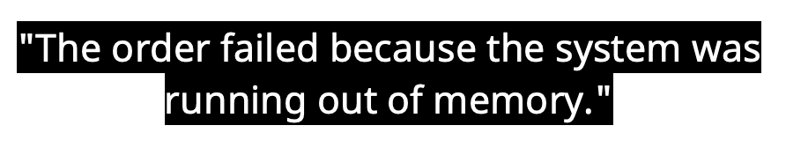
A few months ago we introduced GPT-3 integration that distills these Root Cause Reports down to simple English sentences. This uses the GPT-3 natural language model which is trained by scanning the entire internet for occurrences of relevant technical details, and generating brief “English” descriptions that are easy for a user to scan.
 As we pointed out at the time – this works well when the problem relates to bugs or issues found in commonly used open source or commercial software. However, often the problem is related to a proprietary piece of code which makes it less likely that GPT-3 will generate a good description. We thought long and hard how we could further distil a collection of logs into a set of of keywords that an operator could easily grok, and even use as a navigation aid. And we came up with the idea of adapting Word Clouds for this problem.
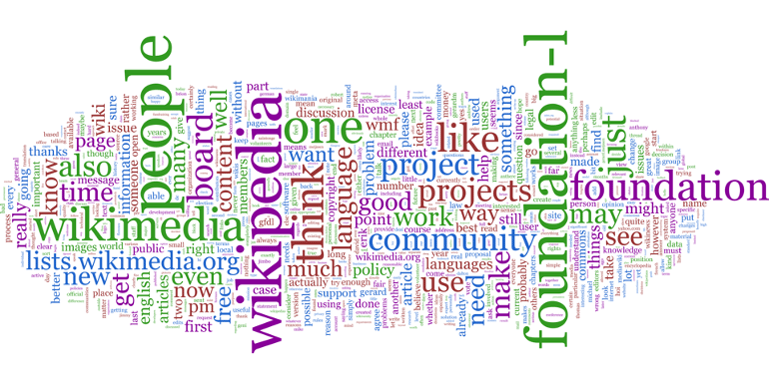
Word Clouds to Capture the Essence of a Root Cause Report
First invented by Flickr, for a time, word clouds were a popular way to visualize keywords or tags for large text repositories – highlighting key terms based on frequency or some other measure of significance. Common implementations use TD-IDF (Term Frequency–Inverse Document Frequency) as a way to measure the significance of keywords in a document.
In the context of log troubleshooting – this does not work well at all. Frequency is actually a contra indicator - frequent terms in logs are actually the least useful from a diagnostic perspective when trying to solve a problem. However, Zebrium’s ML engine has access to other dimensions that are actually quite useful – “rareness” and “badness” (relating to the severity of an event). What if we could pick out keywords and highlight them by size and color based on those dimensions? And then let the user interact with the log summaries by clicking on keywords. It turns out this works beautifully.
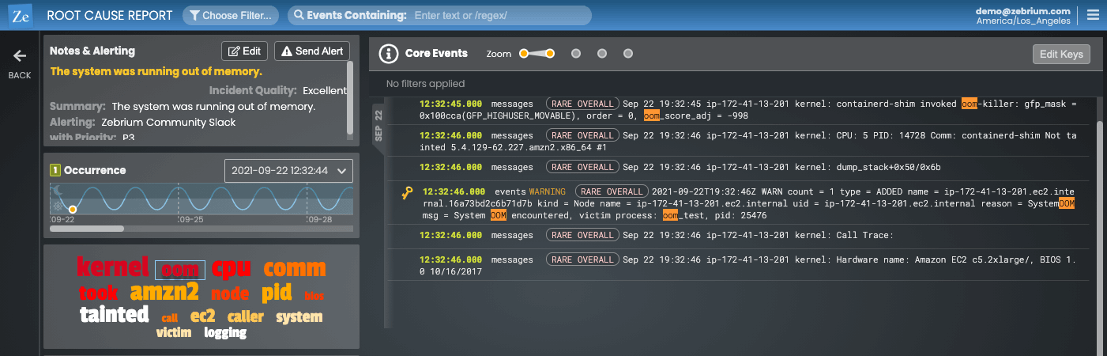
Here are two examples. The first one involves a problem where the kernel ran out of memory and started impacting processes running on the machine. Not only does the word cloud pick out OOM as one of the brightest and biggest keyword, but clicking on it also highlights the matches in the logs making it super quick to understand what was going on in this root cause report.
Here is another example where a chaos experiment that introduced a network corruption into a simple online shopping app, caused the ordering service to crash. Notice how the word cloud picked out the important points of a chaos experiment and network corruption, quickly guiding even a novice user to the problem.
Summary
Zebrium’s machine learning lets you automatically find the root cause of software problems found in logs. In the real world, the ML is very accurate with our customers reporting that Zebrium RCA reports directly contain the most useful log events >90% of the time.
With our latest version, we’ve made it easier than ever for frontline operations staff, SREs and support engineers to quickly understand the problem without at a glance – without needing a deep understanding of the application internals or log events.

