
It takes great skill, tenacity and sometimes blind luck to find the root cause of a technical issue. And for complex problems, more often than not, it involves leveraging log files, metrics and traces. Whether you’re a tester triaging problems found during automated test, or a developer assisting with a critical escalation, dealing with data is painful.
Why is troubleshooting with machine data painful?
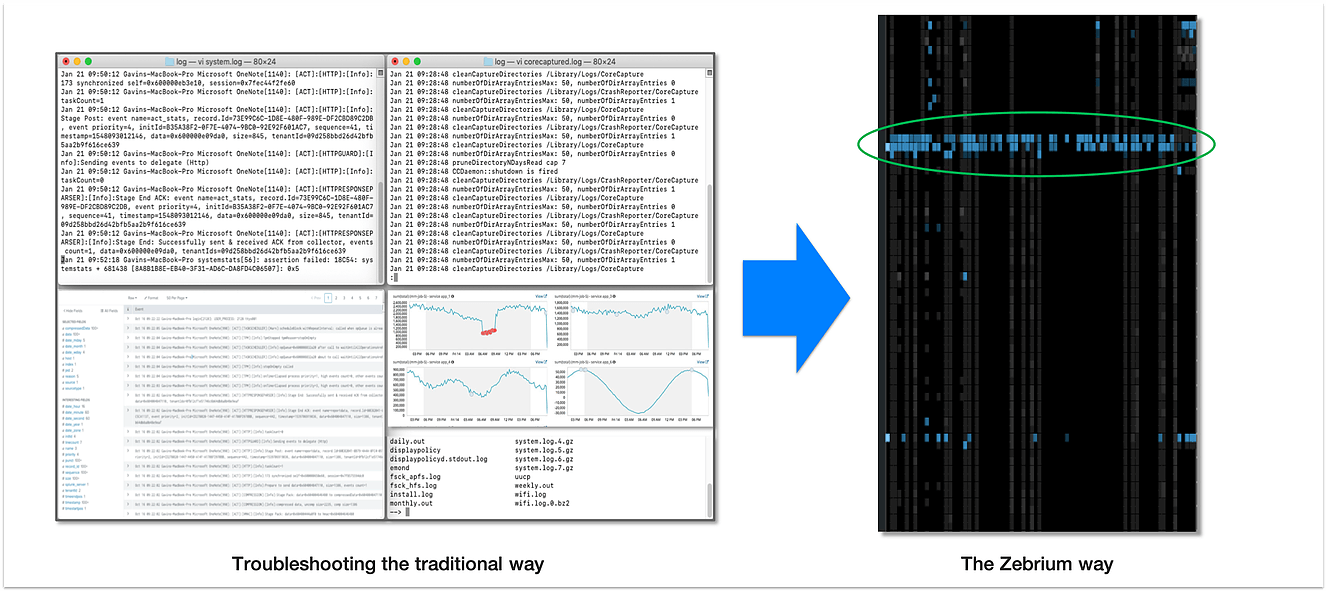
Machine data is messy, mostly unstructured and usually very large. In our customer-base, a mixture of software, SaaS and appliance vendors, typical machine datasets contain millions of lines across tens of files. Typical pain points:
-
Trying to understand what’s happening across multiple different log files is challenging at best - lots of windows, scrolling and patience is needed!
-
Correlating this with charts of metrics adds to the complexity.Writing scripts with grep, awk, etc. to find specific data requires skill and patience, and may not always yield what you were hoping to find.
-
Leveraging tools like Elasticsearch and Kibana speed-up finding something when you know what you’re looking for, but troubleshooting is not like that. And these tools require that you understand the underlying data structures and parse out the parts that are important.
In short, while it’s likely the solution to the problem is buried somewhere in machine data, the process of finding it is ugly.
A new paradigm for troubleshooting?
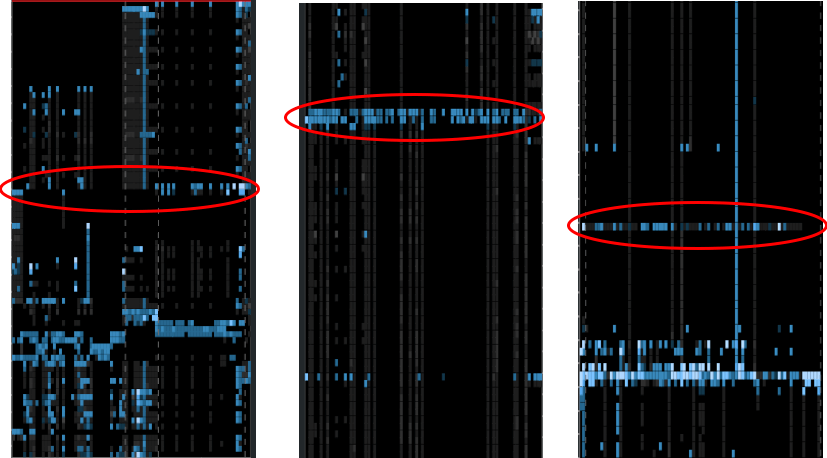
Each of the following pictures represents a machine data bundle. To find the problem, just look for a horizontal blue band where there are one or more bright spots.
What’s going on?
Zebrium uses machine learning (see - Structure is Strategic) to perfectly structure unstructured machine data. This is done inline, without any product knowledge, without regexes and scripts, and without any changes to your software or data. Next, we perform more machine learning magic to understand normal and anomalous patterns. The machine learning is unassisted so you get value from the very first use.
The goal is to show you what’s surprising and likely to represent a problem, and just as importantly, to hide what is not. This is bubbled up as a visualization where “surprise” is represented by the intensity of the small blue squares. Horizontal bands of color typically represent related issues that span multiple parts of the software – i.e. many common problems.
Is this possible?
The above might sound impossible, but it works incredibly well. We’ve seen a broad range of customers quickly find that one in a million events that explains the problem. Using our workbench, problems that would have taken hours or days of painstaking hunting, took just minutes to solve. We’ve had customers tell us that we found the actual root cause, without us they only found symptoms.
What happens once you've solved a problem?
Once you’ve found the root cause of a problem, wouldn’t it be great to create a “signature” so you never have to solve it again? Well, we’ve built exactly that. Stay tuned for part 2 of this blog which explains how we do this.
