We're thrilled to announce that Zebrium has been acquired by ScienceLogic!

Learn More

Root Cause as a Service for Datadog

February 28, 2022 | Gavin Cohen

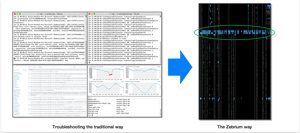
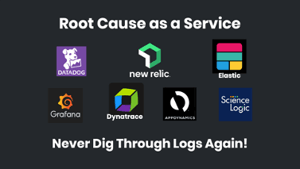
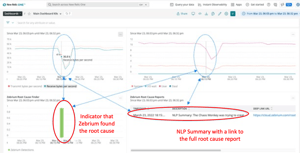
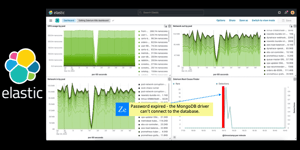
Datadog, like most other monitoring tools, is very effective at visualizing and providing drill-down on metrics, traces and logs. But when troubleshooting, considerable skill and expertise is required to interpret the data and determine the drill-down path to find the root cause. See how Zebrium's Root Cause as a Service simply shows you the root cause right on your Datadog dashboards.

There’s good reason Datadog is one of the most popular monitoring solutions available. The power of the platform is summed up in the tagline, “See inside any stack, any app, at any scale, anywhere” and explained in this chart:

Read More

How to Try Zebrium ML-based RCA Using a Realistic Demo App

October 12, 2021 | Gavin Cohen

Zebrium uses machine learning on logs to automatically find the root cause of software problems. The best way to see it in action is with an application that is experiencing a failure. This blog shows you how to spin up a realistic demo app called Sock Shop, break the app using a chaos tool, and then see how Zebrium automatically finds the root cause. 

The best way to try Zebrium's machine learning is with an application that is experiencing a failure. This blog shows you how to spin up a single node Kubernetes cluster using Minikube, install a realistic demo app (Sock Shop), break the app using CNCF's Litmus Chaos engineering tool, and then see how Zebrium automatically finds the root cause of the problem. 

Read More

Elasticsearch Machine Learning -An Improved Approach Using Correlated Anomaly Detection To Find Root Cause

June 2, 2021 | Gavin Cohen

Native machine learning for ElasticSearch was first introduced as an Elastic Stack (ELK Stack) feature in 2017. It came from Elastic's acquisition of Prelert, and was designed for anomaly detection in time series metrics data. The Elastic ML technology has since evolved to include anomaly detection for log data. So why is a new approach needed for Elastic Stack machine learning?

Native machine learning for ElasticSearch was first introduced as an Elastic Stack (ELK Stack) feature in 2017. It came from Elastic's acquisition of Prelert, and was designed for anomaly detection in time series metrics data. The Elastic ML technology has since evolved to include anomaly detection for log data. So why is a new approach needed for Elastic Stack machine learning?

Read More

What if RCA was done for you in Opsgenie?

May 3, 2021 | Gavin Cohen

We all know the drill. Sun, warm water, tranquility, silence, zzzz... Then your phone blares and buzzes, violently waking you from sleep. It’s dark and you quickly leave the dream behind. With blurry eyes you read, “AppDynamics Alert: shopping_cart_checkout”. Damn, that’s the service that was upgraded this afternoon.

We all know the drill. Sun, warm water, tranquility, silence, zzzz... Then your phone blares and buzzes, violently waking you from sleep. It’s dark and you quickly leave the dream behind. With blurry eyes you read, “AppDynamics Alert: latency threshold exceeded on page: shopping_cart_checkout”. Damn, that’s the

Read More

Try ML-driven RCA using a cloud-native microservices demo app

December 16, 2020 | Gavin Cohen

There is no better way to try Zebrium ML incident and root cause detection than with a production application that is experiencing a problem. The machine learning will not only detect the problem, but also show its root cause. But no user wants to induce a problem in their app just to experience the magic of our technology! So, although it's second best, an alternative is to try Zebrium with a sample real-life application, break the app and then see what Zebrium detects.

*** A new version of this blog that uses a more realistic way to inject an error can be found here. ***


There is no better way to try ML-driven root cause analysis than with a production application that is experiencing a problem. The machine learning will not only detect the problem, but also show its root cause. But no user wants to induce a problem in their app just to experience the magic of our technology! So, although it's second best, an alternative is to try Zebrium with a sample real-life application, break the app and then see what Zebrium detects. One of our customers kindly introduced us to Google's microservices demo app - Online Boutique


Read More

ZELK vs ELK: Zebrium vs Elastic Machine Learning

October 25, 2020 | Gavin Cohen

We often get asked how Zebrium ZELK Stack machine learning (ML) compares to native ML for Elasticsearch. The easiest way to answer this is to see the two technologies side by side. No manual training, rules or special configuration were used for either ZELK or ELK.

We often get asked how Zebrium ZELK Stack machine learning (ML) compares to native ML for Elasticsearch. The easiest way to answer this is to see the two technologies side by side. This short (3 minute) video demonstrates what each solution is able to uncover from the exact same log data. No manual training, rules or special configuration were used for either ZELK or ELK.

Read More

Zebrium Named a 2020 Gartner Cool Vendor

October 22, 2020 | Gavin Cohen

Zebrium has been recognized by Gartner as one of four vendors in the report, "Cool Vendors in Performance Analysis", by Padraig Byrne, Federico De Silva, Pankaj Prasad, Venkat Rayapudi & Gregg Siegfried, October 5 2020. 

The past three months has seen Zebrium reach several major milestones! We moved from beta to production and our platform is now in use by industry leading customers who rely on Zebrium to keep their production applications running. We were named in the Forbes AI50 list as one of "America’s Most Promising Artificial Intelligence Companies". We were written up in DZone as one of the "7 Best Log Management Tools for Kubernetes". We added the capability to augment other logging and monitoring tools, and we recently released ZELK Stack - software incident and root cause detection for Elastic Stack (ELK Stack).

Read More

Is Log Management Still the Best Approach?

May 29, 2020 | Gavin Cohen

Part of our product does what most log managers do: aggregates logs, makes them searchable, allows filtering, provides easy navigation and lets you build alert rules. So why write this blog? Because in today’s cloud native world, while useful, log managers can be a time sink when it comes to detecting and tracking down the root cause of software incidents.

Disclosure – I work for Zebrium. Part of our product does what most log managers do: aggregates logs, makes them searchable, allows filtering, provides easy navigation and lets you build alert rules. So why write this blog? Because in today’s cloud native world (microservices, Kubernetes, distributed apps, rapid deployment, testing in production, etc.) while useful, log managers can be a time sink when it comes to detecting and tracking down the root cause of software incidents.

Read More

Autonomous log monitoring for Kubernetes

November 18, 2019 | Gavin Cohen

Kubernetes makes it easy to deploy, manage and scale large distributed applications. But what happens when something goes wrong with an app? And how do you even know?

Kubernetes makes it easy to deploy, manage and scale large distributed applications. But what happens when something goes wrong with an app? And how do you even know? We hear variations on this all the time: “It was only when customers started complaining that we realized our service had degraded”, “A simple authentication problem stopped customers logging. It took six hours to resolve.”, and so on.

Read More

The hidden complexity of hiding complexity

October 22, 2019 | Gavin Cohen

Kubernetes and other orchestration tools use abstraction to hide complexity. Deploying, managing and scaling a distributed application are made easy. But what happens when something goes wrong? And, when it does, do you even know?

Kubernetes and other orchestration tools use abstraction to hide complexity. Deploying, managing and scaling a distributed application are made easy. But what happens when something goes wrong? And, when it does, do you even know?

Read More

Reliable signatures to detect known software faults

May 22, 2019 | Gavin Cohen

Have you ever spent time tracking down a bug or failure, only to find you’ve seen it before? Or a variation of this problem: at the completion of automated test you have to spend time triaging each failure, even though many are caused by the same bug. 

Have you ever spent time tracking down a bug or failure, only to find you’ve seen it before? Or a variation of this problem: at the completion of automated test you have to spend time triaging each failure, even though many are caused by the same bug. All this can impact productivity, especially in continuous integration and continuous deployment (CI/CD) environments, where things change rapidly.

Read More

Perfectly structuring logs without parsing

May 16, 2019 | Gavin Cohen

Developers and testers constantly use log files and metrics to find and troubleshoot failures. But their lack of structure makes extracting useful information without data wrangling, regexes and parsing scripts a challenge.

Developers and testers constantly use log files and metrics to find and troubleshoot failures. But their lack of structure makes extracting useful information without data wrangling, regexes and parsing scripts a challenge.

Read More

Troubleshooting the easy way

February 9, 2019 | Gavin Cohen

It takes great skill, tenacity and sometimes blind luck to find the root cause of a technical issue. Zebrium has created a better way!

It takes great skill, tenacity and sometimes blind luck to find the root cause of a technical issue. And for complex problems, more often than not, it involves leveraging log files, metrics and traces.  Whether you’re a tester triaging problems found during automated test, or a developer assisting with a critical escalation, dealing with data is painful.

Read More

Product analytics at your fingertips

December 11, 2018 | Gavin Cohen

According to Gartner, product analytics “help manufacturers evaluate product defects, identify opportunities for product improvements, detect patterns in usage or capacity of products, and link all these factors to customers". The benefits are clear. But there are barriers – product analytics are expensive in terms of time, people and expertise.


According to Gartner, product analytics, “help manufacturers evaluate product defects, identify opportunities for product improvements, detect patterns in usage or capacity of products, and link all these factors to customers". The benefits are clear. But there are barriers – product analytics are expensive in terms of time, people and expertise.

Read More

Featured Posts

FREE SIGN-UP