
Disclosure – I work for Zebrium. Part of our product does what most log managers do: aggregates logs, makes them searchable, allows filtering, provides easy navigation and lets you build alert rules. So why write this blog? Because in today’s cloud native world (microservices, Kubernetes, distributed apps, rapid deployment, testing in production, etc.) while useful, log managers can be a time sink when it comes to detecting and tracking down the root cause of software incidents.
Quick history
When troubleshooting software problems, engineers have forever hunted through logs to find root cause.
This used to be done manually by writing perl scripts, or using native tools like vi, grep, sed, awk, etc. This changed in the early 2000's when log managers appeared on the scene, makiing this process smoother, faster and more scalable. Splunk, the first commercial product to arrive, was aptly termed “Google for log files”.
Since then, log management tools have proliferated with a mix of open source tools like the Elastic Stack (often called ELK Stack, short for Elasticsearch, Logstash and Kibana) and commercial products like Sumologic. Today, they vie for leadership in dimensions such as cost, scalability, and speed of search, but they are all still based on the fundamental idea of making logs easier to search.
Is search still the right paradigm?
Troubleshooting and finding root cause require patience, skill, experience and intuition. With enough time, a skilled operator can usually determine root cause. The process typically starts with a search for keywords like error, critical, abort, panic, etc. And then continues with a journey of iterative searches that narrow things down to root cause.
"I don't know what I'm looking for, but I'll know when I find it!"
But some problems don’t show themselves through obvious error severity log events and some are elusive because they’re intermittent and hard to characterize, etc. Where do you even start when all you know is that a user said, “my screen just froze”?
Complexity and scale make things worse
When Splunk was founded in 2003, things were a lot simpler: Apps were monolithic, mostly deployed on-prem and log volumes were relatively small (fewer log files with fewer lines per file). When something went wrong, it would typically impact one customer at a time.
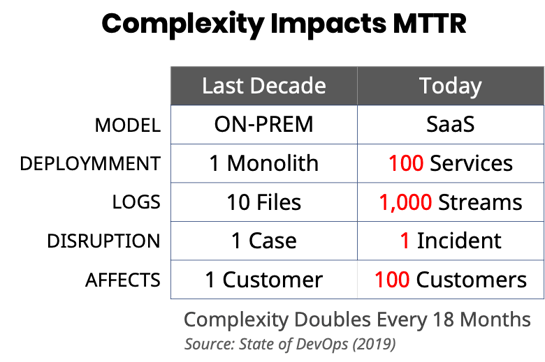
But with today’s distributed SaaS applications and extensive use of microservices, things are very different. It’s not uncommon to see apps that have hundreds of microservices and produce billions of log lines a day. The process of iteratively searching through so many logs across so many services, with a vast and ever-growing set of failure modes can be very daunting, especially while multiple customers are waiting for an issue to be resolved. How do you know what to search for and how do you sift through the huge volumes of data that your searches might return?
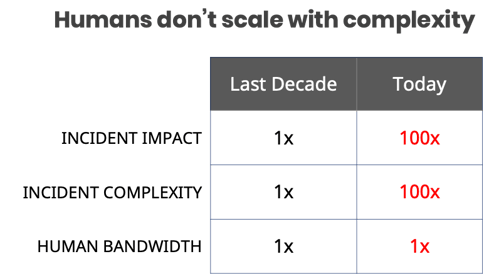
Unfortunately, human-driven troubleshooting doesn’t scale with complexity, and this is impacting Mean-Time-To-Resolution (MTTR) which today is measured in hours and days, driven by the long tail of obscure and previously unknown issues that keep cropping up.
Parsing to get at the payload
Most logs are messy and unstructured (more accurately, there is usually clear structure for each individual type of log event, but within a log there might be thousands of different event types each with a different structure).
This is even true for logs that conform to standards like syslog RFC 5424. It defines that a log line should have structured components like a timestamp, severity, process ID, etc. But, what is often the most important part of a log line – its payload – has no structure at all (from the RFC, “The MSG part contains a free-form message that provides information about the event”). Even the recent trend of structuring logs in JSON or XML is often plagued with the same issue, where buried in a cleanly structured blob sits the same old payload in a single unstructured field!
Enter the parser...
Let’s say it’s really important to get at specific information inside log lines to troubleshoot a problem. E.g. you want to compare the number of times status “timeout” occurred across all the different instances of a service for an event like this:
May 27 11:56:11 host-47 myservice[24112]: Service instance X completed with status Y
You would need to parse out fields X and Y. In the past you would have written a script and crafted regular expressions (regex) using grep, sed or awk. Today, each log management tool provides its own mechanism to parse out specific fields. For example, the open source logstash grok plugin filter. Unfortunately, it takes a lot of time and effort to build and maintain these fragile parsing expressions. Especially as log events change across different software versions.
The quest for automation: do log managers help?
Automation is what sets apart the best DevOps teams. Google dedicates an entire chapter to automation in their famous SRE book. One of the headings in that chapter famously reads:

Log managers are useful for automating the detection and root cause identification of some software incidents. This is achieved by building alert rules that monitor logs for particular events, values within events and/or sequences of log events. As long as you know what the events/values are that characterize the problem, this approach can work well.
You can’t automate the unknown unknowns
Unfortunately, you can only build alert rules for symptoms / causes that you understand and can be well-defined through log events. This leaves a big gap for incidents where you don’t know the cause, the symptoms or both. In these cases, the troubleshooting process relies entirely on the skill of the operator and the searches and techniques used to uncover root cause – which (as discussed above) is hard to scale as complexity increases. For example, you might be able to build an alert that tells you when latency is too high (known symptom), but you would still need to manually search for one of the thousands of possible root causes.
Is there a better way?
The idea of building a tool that aggregates and makes your logs searchable was revolutionary and log managers have proven to be useful and better than the alternative of writing scripts and building pipelines to collect and manage logs. But what worked well almost two decades ago (“Google for log files”) hasn’t kept up with the complexity of today. The manual process of searching for an obscure, previously unknown failure among hundreds of log streams can be extremely costly.
We believe that a fundamentally different approach is needed – one that is based on machine learning rather than human-driven search. It might sound far-fetched, but despite the complexity of today’s apps, software still breaks in fundamental ways that are visible as pattern changes in logs. In the same way that skilled DevOps engineers are adept at finding these patterns, machine learning models can be trained to do the same thing. And machine learning, unlike humans, can scale with complexity. If you’re interested in learning more, please read our blog: The Future of Monitoring is Autonomous.
