
Native machine learning for ElasticSearch was first introduced as an Elastic Stack (ELK Stack) feature in 2017. It came from Elastic's acquisition of Prelert, and was designed for anomaly detection in time series metrics data. The Elastic ML technology has since evolved to include anomaly detection for log data. So why is a new approach needed for Elastic Stack machine learning?
Why use Machine Learning on Elasticsearch Logs in the First Place?
Detecting and diagnosing the root cause of software problems is a slow and tedious process, particularly for new (previously unseen) failure modes. Think about what a skilled SRE or developer does when troubleshooting an unknown or complex problem: First there’s hunting through logs and dashboards for familiar clues and error conditions. Once the familiar ones are exhausted, it’s about looking for new or rare errors, or event patterns that seem different from the norm. And finally, it might involve correlating event sequences across logs from different services. The ultimate goal of using Elastic Stack machine learning (ELK Stack ML) is to have a system that can automate the troubleshooting process.
Limitations of the Native Elasticsearch Machine Learning Stack
In the context of troubleshooting software problems, Elastic machine learning offers two main anomaly detection capabilities for log data (these are described below). In testing at Zebrium and based on customer feedback, the results using ELK Stack machine learning were noisy and required a significant amount of human effort to interpret (you can see an example in this video).
Native Elastic Anomaly Detection Using Event Categorization
This technique first categorizes log events by type. Accurate categorization is critical in order to find log anomalies. Elastic ML uses a tokenization and clustering technique, which in testing does not work accurately for rare event types (i.e. when there are only a few examples of an event category). Unfortunately, being able to find rare events is one of the highest value signals when troubleshooting.
Once events have been categorized, a user can define a time bucket (e.g. 15 minutes or 1 hour) and set up an Elastic Stack log anomaly detection job to look for anomalous counts of outlier event categories within each time bucket. The number of anomalies, and their usefulness, can vary considerably depending on the chosen time bucket size.
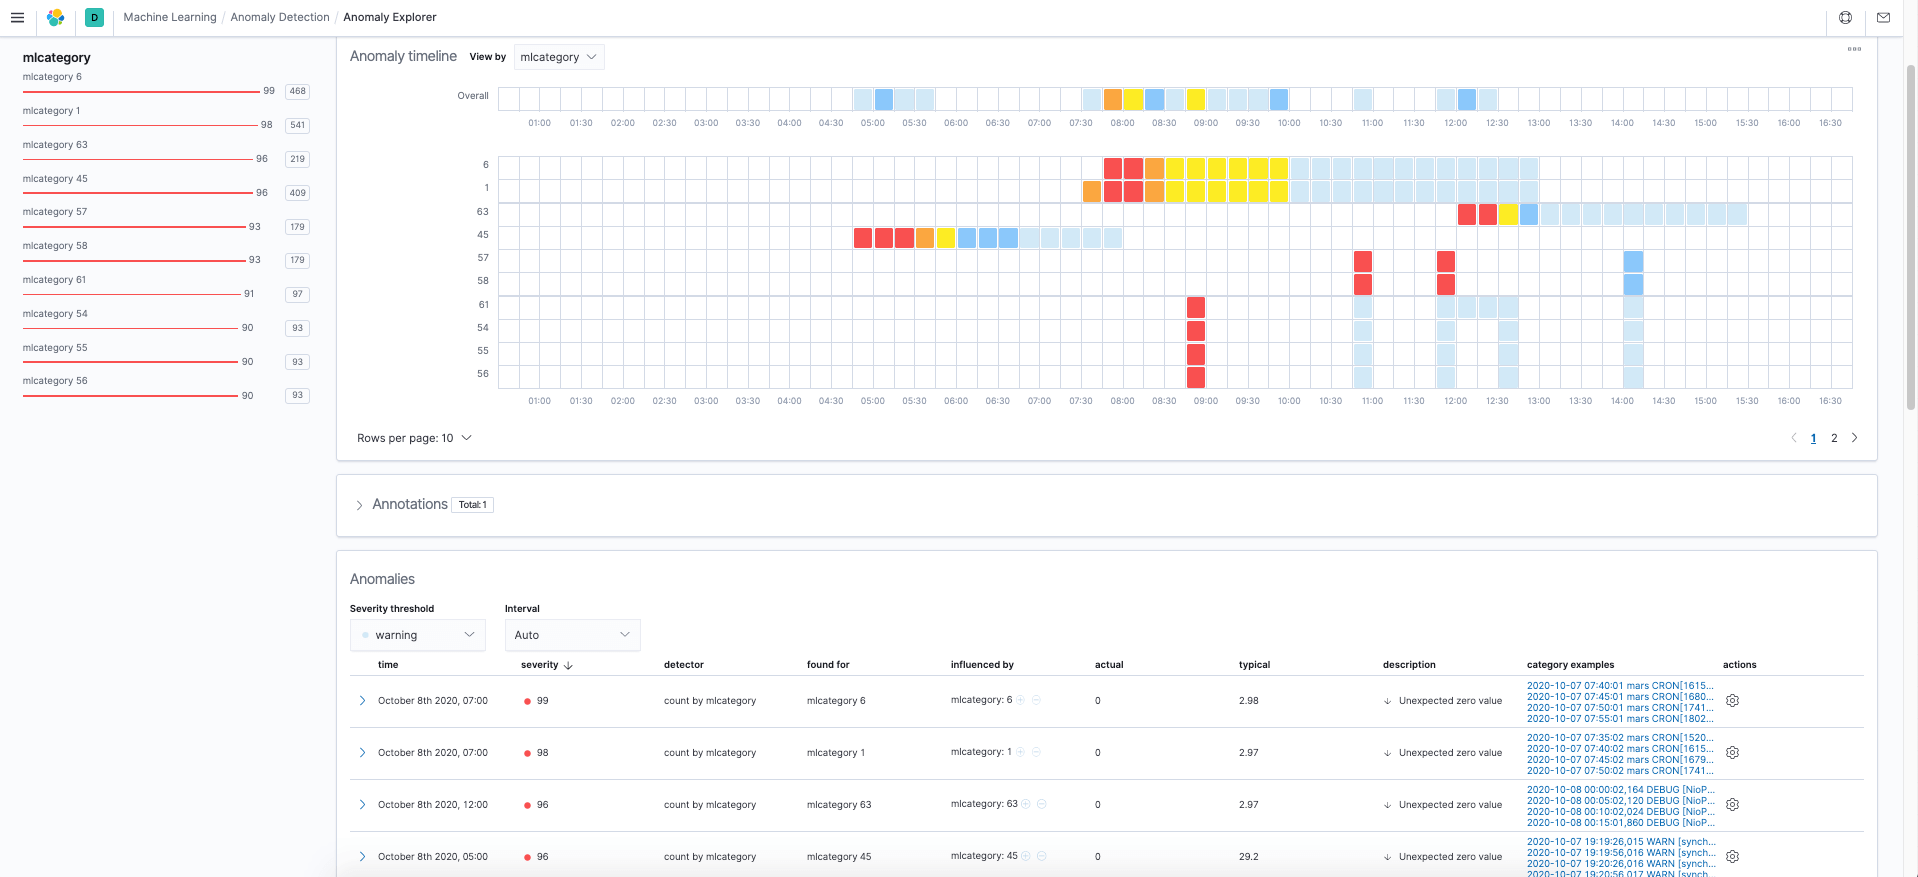
Anomalous event categories |
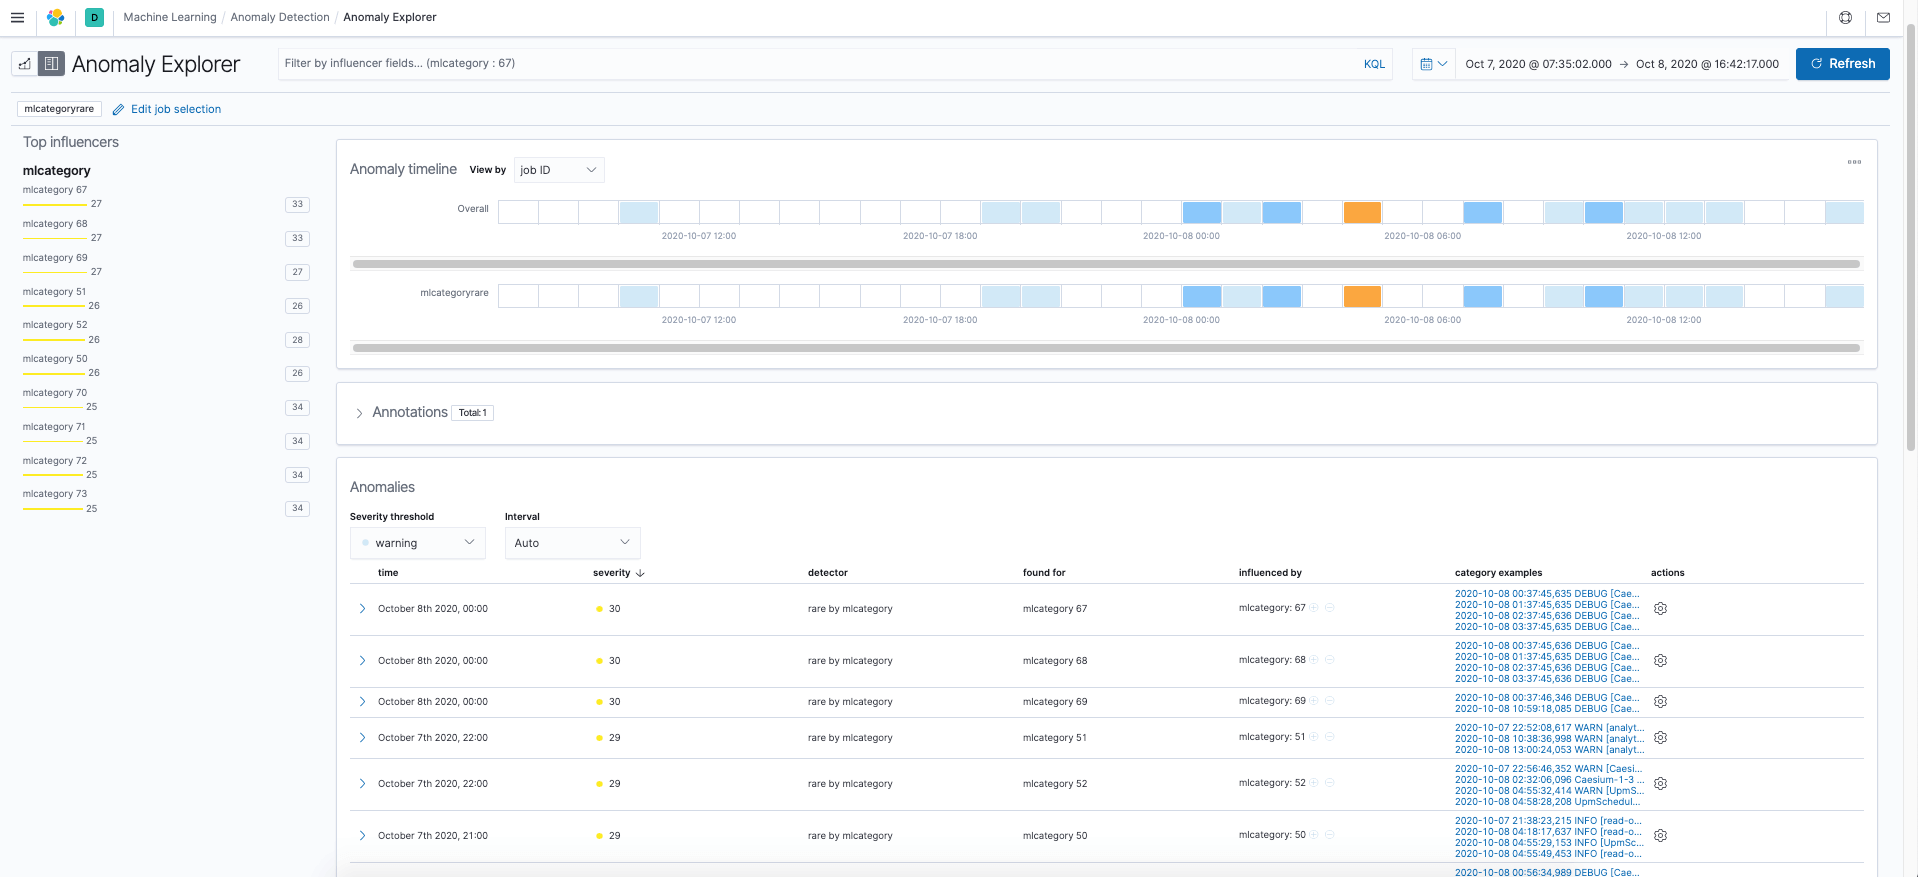
Rare event categories |
Click images to enlarge images (images will open in a new tab)
In testing and based on customer feedback, results from native Elasticsearch ML tend to be noisy. You can see what it looks like in the Kibana images above which show anomalous event categories (left image) and rare event categories (right mage) for a set of logs collected while a software incident was occurring.
During troubleshooting, a user would need to manually inspect each anomaly (there are many pages of them) to determine its relevancy to the problem at hand. This is made all the more difficult because Elastic Stack ML shows examples events for each anomalous category rather than the actual log lines that might relate to a problem.
Anomaly Detection on Elasticsearch Log Ingest Rate
Elastic also has the ability to use machine learning to show abnormal (anomalous) log ingest rates. Here's an example:
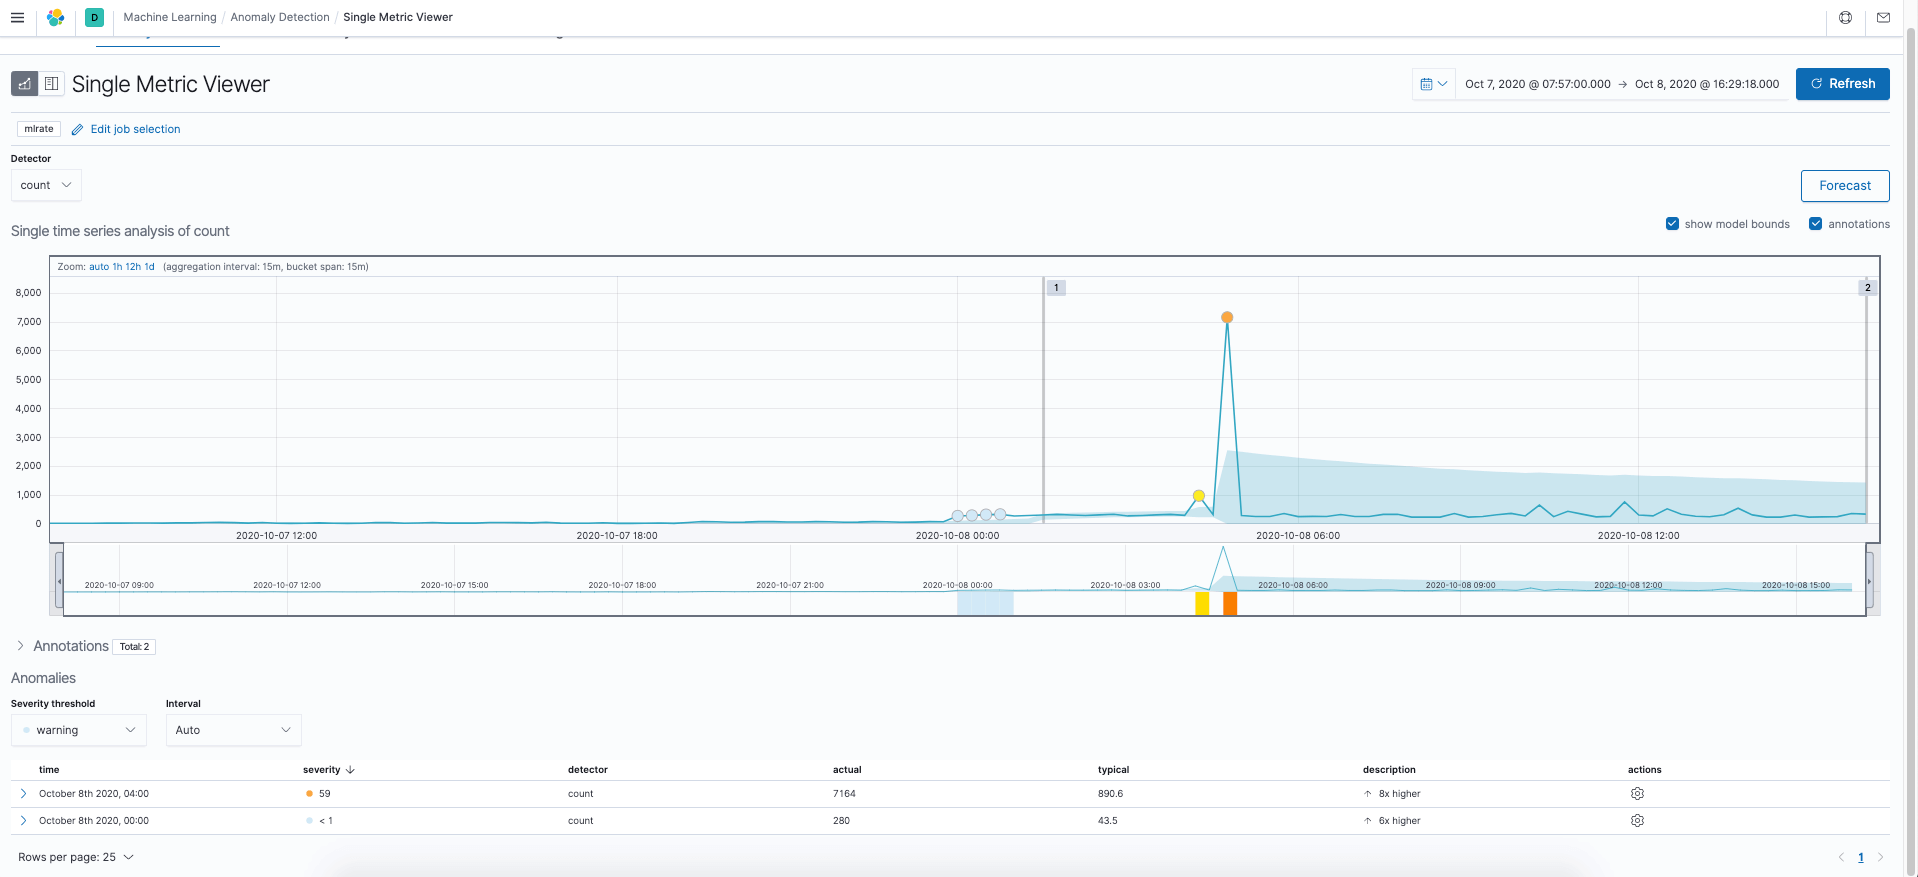
Anomaly detection on ingest rate (click to open in new window)
Depending upon the type of problem, swings in log ingest volume can be helpful to narrow down the time frame in which a problem occurred. However, a user would still need to manually search through the logs to understand what actually happened.
A New Approach to Elastic Stack Machine Learning
Rather than focus on just anomaly detection, Zebrium uses a multi-layered machine learning approach to automatically find the root cause of software incidents. This is described in detail here.
It starts by structuring and categorizing logs into unique event types (Zebrium categorization is far more accurate than other techniques - see here), and then scores each incoming event based on how anomalous it is.
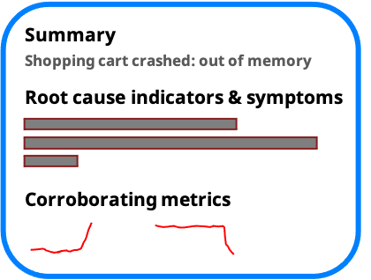
Although Zebrium's log anomaly detection is very accurate, the anomalies still tend to be noisy, so in order to find the signal from the noise, the ML looks for correlated clusters of anomalous events across logs. This fundamental step uncovers a sequence of log events that can be used to explain the root cause. It then goes one step further and uses GPT-3 to generate a plain language summary of the problem (see here).
The net result is that rather than showing all anomalies, the user is presented with an easy to read root cause report that explains exactly what happened. No hunting or interpretation is needed.
Seamless Integration with ELK
Zebrium's ML for Elasticsearch solution (called ZELK Stack) is designed to integrate seamlessly into the Elastic Stack. It does not require any complex configuration or manual training, and automatically shows you root cause log events right inside Kibana.
The following video provides a short demonstration of the Zebrium ML solution for Elasticsearch.
Configuration only takes a few minutes (see docs for full details). Just add a Logstash output plugin to send logs to Zebrium and an optional input plugin for Zebrium to send root cause reports back to Logstash. The rest is automatic. The solution starts producing accurate results within the first 24 hours.
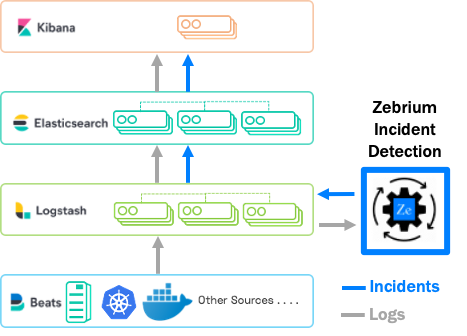
How Zebrium integrates with the Elastic Stack
Proactive Incident and Root Cause Detection
Zebrium's machine learning continually scans incoming logs for correlated clusters of anomalies. When one is found, a root cause report is created and will automatically appear in an Elasticsearch incident root cause index. The user does not have to do anything!
Below, you can see a Kibana canvas that visualizes a Zebrium root cause report summary.
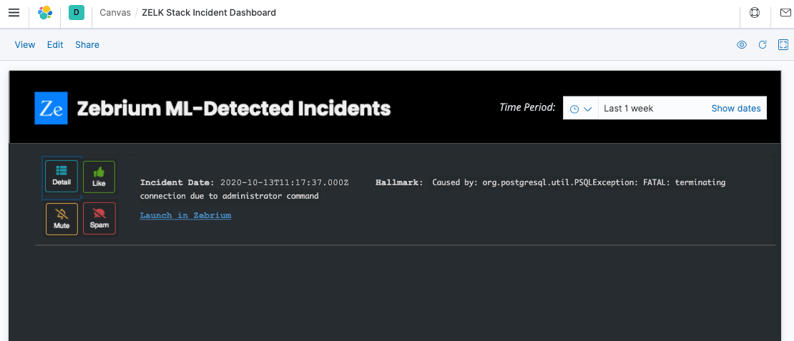
The buttons behave as follows:

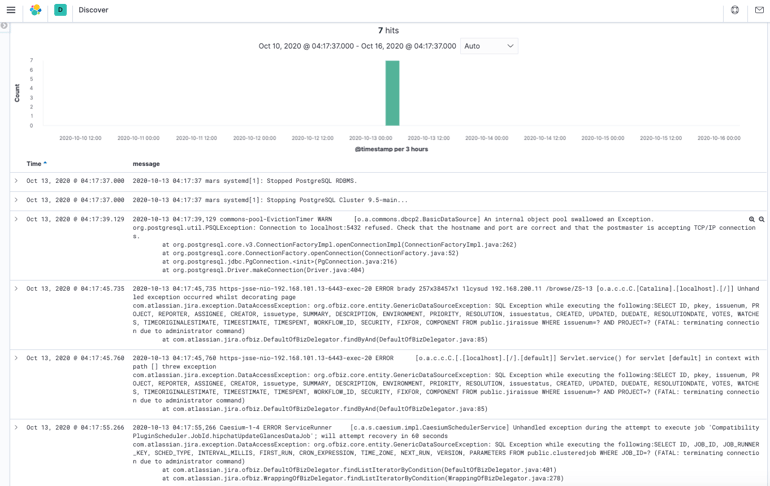
- Detail – Drills down to a Kibana discover or logs view to show the root cause of the incident as a series of log events. See the example below - note that the ML has picked out just seven correlated events to explain what happened out of millions of log lines that occurred while the problem was happening:
- Like, Mute and Spam – Provides feedback to Zebrium ML and customizes how future similar events will appear in the root cause report list.
- The link “Launch in Zebrium” allows you to drill down on the root cause report inside the Zebrium UI (rather than in Kibana). The result is similar to using Detail except that the Zebrium interface offers some very useful drill-down features compared to native Kibana.
How Does Zebrium Compare to Native Elastic ML Anomaly Detection?

As described above, Elastic X-Pack supports ML anomaly detection and can find anomalous log rates based on overall ingest or based on log event categories. You can then set up machine learning jobs to look for rare or anomalous counts of categories within a user defined “time bucket”. Although this type of anomaly detection can be useful when looking for problems, it tends to produce noisy results (false positives) and requires significant human effort to find correlations and to interpret details of root cause.
The approach Zebrium has taken finds correlated clusters of anomalies across log files and presents them as root cause reports with a sequence of log events and a plain English summary. This not only uncovers just the relevant log lines, but cuts through the painful process of manually drilling down on each of many log anomalies.
| Native Elastic Stack Machine Learning | Zebrium Elastic Stack Machine Learning | |
| Configuration | User defines jobs and time buckets | Automatic |
| Event categorization | Tokenization and clustering | Multiple ML stages based on number of event samples for highly accurate categorization even for rare events |
| Event correlation across logs | Human-driven | Automatic |
| Results | Dashboards showing anomalies with drill-down to example log events | Root cause reports with correlated log lines and plain English summary |
Try it with Your ELK Stack and See What the Machine Learning Finds
The best way to see how Zebrium works is to try it with your own data, using your own Elastic Stack. Installation of the Logstash output plugin only takes a few minutes and the solution achieves accuracy within 24 hours.
Sign-up for a free trial and experience the power of proactive incident detection and automatic root cause analysis.

FAQ
What is Elastic Stack Machine Learning?
Native Elastic Stack machine learning is a form of anomaly detection that can be used on logs. It attempts to find anomalous log ingest rates and anomalous log event categories within log files that are indexed by Elasticsearch. Although it can be useful for log analysis, it tends to produce noisy results (false positives) and requires significant manual effort compared to other approaches such as the Zebrium ZELK Stack.
What are the Best Elasticsearch Machine Learning Alternatives?
Zebrium offers an alternative solution for machine learning in the Elastic Stack. The Zebrium approach automatically uncovers the root cause of software incidents by finding correlated clusters of log anomalies.
What are the Best Practices for Using Machine Learning in ELK?
The best practice for using Zebrium machine learning for the Elastic Stack is to install an output plugin for Logstash. This redirects a copy of log data to Zebrium service so that the Zebrium ML can automatically find correlated clusters of anomalies across the logs. These can be sent back to an Elasticsearch index by using a Logstash input plugin. The resultant "root cause reports" can be viewed directly inside Kibana.
NOTES ON TRADEMARK USAGE
- Elasticsearch is a trademark of Elasticsearch BV, registered in the U.S. and in other countries.
- Kibana is a trademark of Elasticsearch BV, registered in the U.S. and in other countries.
- Logstash is a trademark of Elasticsearch BV, registered in the U.S. and in other countries.
- Beats is a trademark of Elasticsearch BV.
- Elastic is a trademark of Elasticsearch BV.
- X-Pack is a trademark of Elasticsearch BV.
